Stop-and-frisk Vs. Title VI

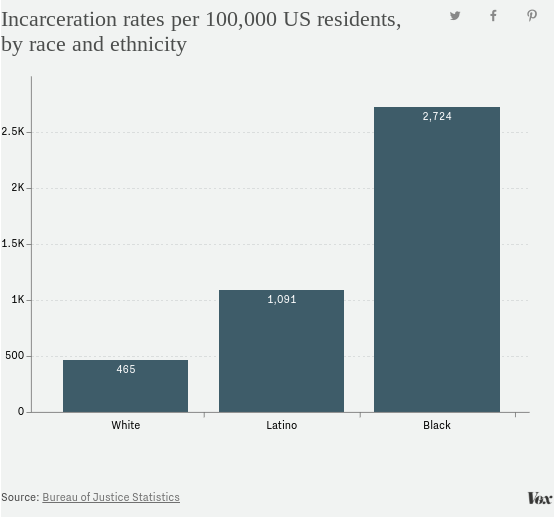
According to NAP, in 1972, 161 per 100,000 of the US population was incarcerated.  However, at the end of 2016, this number had risen to 655 for every 100,000. This means that currently around 2.2 million adults are behind the bars in US prisons and jails. As seen in the bar chart below, it has been claimed that the War on Drugs started in 1971 has disproportionately harmed black and African American communities, particularly black men.(Vox) One of the ways this has happened is through the stop-and-frisk interrogations used by the police to find drug-users and traffickers on the streets. A NYCLU study has shown that between 2002-2017, black people are around 55% of all stop-and-frisk targets of the NYPD, while whites constitute between 9-15% of such targets. This data clearly shows systemic discrimination against black and African-American communities since according to the 2010 census, 33% of NYC population was white, and 26% was black. (furmancenter.org) As a result, black men are almost 6 times as likely to be incarcerated as white men. (Vox) So, if systemic discrimination has been the reason for the disproportionate targeting of black men, why hasn’t Title VI been effective to prevent minority groups from being incarcerated?

Title VI of 1964 “prohibits discrimination on the basis of race, color or national origin in any program or activity that receives Federal funds or other Federal financial assistance.” (hhs.gov) More specifically, this law claims to prevent “a predominantly minority community…[being] subjected to harsher rules than a predominantly non-minority community.” Even though Title VI is supposed to protect minority groups from discriminatory treatment from federally funded institutions like the police department, the law is highly inaccessible in the case of stop-and-frisk operations.

First, the methods based on direct evidence can rarely be used to prove that racial discrimination has happened in the age of political correctness. The method(s) of direct evidence consists of either “express” classifications or “comments or conduct by decision-makers as direct evidence of intent.” (justice.gov) When charged with racial bias in a case of stop-and-frisk, it is very unlikely that a police officer will admit to have interrogated someone based solely on their racial background. Moreover, most states allow the police to stop and interrogate anyone on the street based on their judgement of reasonable suspicion, and anything can constitute reasonable suspicion, including but not limited to suspect “was wearing low-waisted jeans,” or “looked nervous”, or even “didn’t look nervous.” This allows the police to always have a justification if they get charged with a Title VI violation. Once the charge has been dismissed, the prosecution can take place as normal, and lead to conviction of the person targeted in the stop-and-frisk.

While Title VI violations can easily be ignored and covered in individual instances of stop-and-frisk, Title VI also protects minority groups from “systemic or widespread discrimination.” (justice.gov) According to the US Department of Justice, “one means of proving intentional discrimination is through circumstantial evidence showing a statistical disparity that affects a large number of individuals.” In the  case of stop-and-frisk, one could show how police departments tend to systematically target poor African-American neighborhoods over rich, white, suburban or college neighborhoods, which have almost identical chances of having possession of illegal drugs and marijuana. However, reasonable suspicion can be used to justify frisking African-American neighborhoods: the police can effortlessly claim that drug-related activities and crimes have been found to happen in similar neighborhoods. This tactic of reasonable suspicion has been and continues to be used to justify the targeting of black men in stop-and-frisk operations.

Stop-and-frisk operations are unfair and harmful since it gives government institutions like the police immense power to target specific groups and individuals. At the end of the day, each person has prejudices and biases and controlling such variables would be incredibly difficult. A person committing the same crime should not be penalized more than another based on the color of their skin and socio-economic background. In America, black people are thrown under the bus frequently. As long as the police are allowed to conduct stop-and-frisk operations in the neighborhoods that they choose, the enforcement of Title VI to protect black and African-American men from statistically unfair rates of incarceration is next to impossible.

Why the Stall for “The Wall”?

In May 2018, Trump stood in front of signs which read “Promises made, Promises kept” and reassured the general public that Mexico would pay for the wall that would divide the U.S. and Mexico. Trump has made this claim over 212 times, so why has the wall yet to be built?
Clearly this was a wishful promise made on the campaign trail that has had a difficult time facing its reality within the federal government. Unfortunately for the president, Mexico will not be paying for the wall, and cannot be forced to do so. The graph below has an array of implications that must be unpacked prior to analyzing if the data behind building a wall is sound. The density of claims made by Trump lie within his campaign season throughout 2016. This can be attributed to his multiple campaign speeches, rallies, and the building of his voter base. Once Trump was sworn into office, the claims significantly decline in both number and frequency. The Wall was a hefty promise that had fallen to the wayside in the beginning of Trump’s presidency. But, the beginning of 2018 saw an increase in wall mentions due to the discussion of the revision of NAFTA–now known as the USMCA. Now that the context of the wall mentions is known, we can analyze why the wall has yet to be built and/or paid for.

In November 2018 the USMCA (United States Mexico Canada Agreement–essentially a “revamped NAFTA”) was implemented, and with the new legislation came new promises.

With the release of Trump’s tweet, should Americans not all be reassured that even if Mexico will not directly pay for the wall, then this new trade agreement will? Unfortunately for the president and his supporters, not so much.
In the tweet, Trump is referring to the (potential) decrease of the trade deficit with Mexico from the USMCA. However, a decrease in the trade deficit does not cause an increase in the federal government’s money supply. A trade deficit means that country A buys more goods from country B, than country B buys from country A. With the USMCA, the U.S. will be buying fewer goods from Mexico. Purchasing goods from within the U.S. instead of Mexico will theoretically lower the deficit, but the money saved from purchasing U.S.-based-goods remains with the consumer, and not the federal government. Therefore, Mexico would still not be paying for the wall, even indirectly.
Using relatively simple math, it is clear that the data does not support Trump’s claims.


“What’s more, Trump already starts at a disadvantage. In 2016, the trade deficit with Mexico was $55.6 billion, meaning that it increased by $8 billion during Trump’s first year in office. Presumably then, we need the trade deficit to drop by $26 billion — that $8 billion increase plus the $18 billion cost for the wall — to come out ahead on this thing”. (Bump 2018)

The data above from the Washington Post article is sufficient because the author uses trade data that is well known and federally backed. Furthermore, the data is supported by the simple understanding of how a trade deficit operates and what lowering the deficit implies for each country–meaning that Mexico does not necessarily lose money and the United States does not gain money either.
The conclusions drawn by the Washington Post are sound in math and logic, but it must be noted that the Washington Post is left-leaning and is particularly averse to the current administration. However, political biases aside, the data is against the president’s claims and the wall will most likely have to wait to be built for another time.

Citations:

Kelly, Meg. “No, the USMCA Doesn’t Mean Mexico Is Paying for the Wall.” The Washington Post, WP Company, http://www.washingtonpost.com/video/politics/no-the-usmca-doesnt-mean-mexico-is-paying-for-the-wall/2019/01/08/f22dd079-d74b-4592-a802-6fbd60ff8e03_video.html?utm_term=.460123e14037.

Bump, Philip. “Trump Got Mexico to Pay for the Wall by Simply Changing the Meaning of ‘Pay’ and ‘Mexico’.” The Washington Post, WP Company, 13 Dec. 2018, http://www.washingtonpost.com/politics/2018/12/13/trump-got-mexico-pay-wall-by-simply-changing-meaning-pay-mexico/.

Should More Obstetric Care be Implemented in Rural Counties?

As the use of new technology increases and doctors and scientists know more than ever before, healthcare practices should in theory be getting safer and more prominent. Literacy and education related to pregnancy is growing. More information on obstetric care is increasing. Obstetric care is crucial for women’s health, the World Health Organization describes that basic essential obstetric care should include “parenteral antibiotics, parenteral oxytocic drugs,  parenteral sedatives for eclampsia, manual removal of placenta and manual removal of retained products” (WHO 2000). There is a more comprehensive list, but the previous examples are essential. In April of 2017 the University of Minnesota Rural Health Research Center conducted a study on the loss of obstetric services in the United States, which disproportionately affect  rural counties. This study’s information came from the American Hospital Association, where about 6,300 hospitals spread throughout the United States reported on loss of obstetric care. Because hospitals and obstetric care services are rapidly declining, should more obstetric care be implemented in rural areas?


Compared to micropolitan area, rural counties are losing obstetric services at a much    faster rate. The number of hospitals that provide obstetric services declined by 25% in eleven years (RHRC). Rural counties are being more isolated not only because of hospital closures, but because obstetric care is not being offered to these communities, mostly in noncore areas. The findings also saw a trend that obstetric unit closure is more likely in counties with low birthweight and lower median household income. This is important to look at because it brings into question the lack of services that are essential to providing obstetric care for women. The chart below shows distribution among micropolitan and noncore rural areas. The loss of obstetric services in noncore areas are significantly higher than micropolitan areas.

This study calls for a need to asses obstetric care on a regular basis, however does not provide information about how many women now lack access to obstetric care. This study shows that hospitals and obstetric care is decreasing in rural counties, but it does not focus on other variables affecting women’s health. There are a lot of other variables and demographics that would be helpful to measure to determine what essential obstetric care services women do not have access to and are in need of. A more comprehensive study could identify the essential care that is lacking, and possibly improve obstetric care for women in rural areas.While there are micropolitan areas and urban communities, most of the United States is considered to be  rural counties. The populations of people are vastly different and it is crucial to provide access to obstetric care to all women to reduce the risk of pregnancy.

This study does a good job at representing rural counties in the United States because there are approximately 3,000 counties in the United States, so this is a representative sample of counties. It also highlights not only hospitals that have been shut down in rural communities and therefore do not offer obstetric care but count for closures of just obstetric units. The data from this study overall show that there is a need to extend obstetric care in rural counties even though women demographics were not included in this study.

References:

http://rhrc.umn.edu/wp-content/files_mf/1491501904UMRHRCOBclosuresPolicyBrief.pdf

https://www.cdc.gov/reproductivehealth/maternalinfanthealth/infantmortality.htm

https://www.acsh.org/news/2017/10/25/infant-mortality-25-higher-rural-areas-12031

https://www.cdc.gov/nchs/products/databriefs/db285.htm

http://www.nzdl.org/gsdlmod?e=d-00000-00—off-0cdl–00-0—-0-10-0—0—0direct-10—4——-0-1l–11-en-50—20-about—00-0-1-00-0–4—-0-0-11-10-0utfZz-8-00&cl=CL1.177&d=HASHdf54d1ccac38838ac10c04.2&gt=1

Xi’s File Cabinet

Depictions of dystopian governments, from Orwell to Black Mirror, often make an effort to include systems of surveillance in their fiction.  These systems track, catalogue, and manage citizen’s lives, leveraging behavior for the good of the state and curbing dissent at every opportunity.  And, aside from those that wield the levers of power, there is almost no perception of the surveillance state as benevolent. But if we consider the argument put forward by Alex Pentland in “A Data Driven Society”, one that highlights the need for systems that can manage and direct what he calls “idea flow” (Pentland 81), can we begin to construct a “benevolent” surveillance state?

The People’s Republic of China, although a far cry from Orwell’s Oceania, has a history of surveying and policing its citizens behavior.  Dating back to as far as the 11th century, more recent surveillance ventures began after the 1949 takeover by the Chinese Communist Party.  These programs were aimed at monitoring movement and loyalty to the state and placed citizens at odds with one another (Mistreanu 4). In 2014, the State Council announced the next step: a “national credit system” that would “allow the trustworthy to roam everywhere under heaven while making it hard for the discredited to take a single step” (Planning Outline).  Intended on being fully implemented by 2020, this announcement sent many Western journalists and human rights advocates spinning.

And while they’re concerns are justified, the CCP has a history or punishing dissent, the aim of the social credit system is, at least on paper, quite benevolent.  The aim is promoting good behavior through tangible rewards given to citizens who perform certain behaviors. Citizens of Rongcheng, one of three cities part of the CCP’s pilot program, are given 1,000 points to begin with, a number that changes depending on recorded behavior.  From there, five points can be taken away for a traffic ticket, exemplary business or commitment to family can earn someone 30 points, and even charity work is logged and rewarded (Mistreanu 2). All private citizens, and businesses, are beholden to this scoring system (Mistreanu 2).

What’s fascinating about this system is that it is not carried out by the central government alone.  In fact, there is no “national” social credit system in any sense. Instead, the social credit system being implemented across China is a decentralized patchwork of credit values, each with their own scoring factors, operating out of online payment providers like AliPay, city governments, hospitals, and even libraries (Mistreanu 4).

This effort illustrates the potential reality of using data at local, regional, and national levels to “nudge” behavior in beneficial ways.  With the amount of data swimming around in the aether, it only makes sense that it be used as leverage to construct a better society. But there are issues.  The Chinese social credit system is not a radical change. In fact, one could argue it is simply a way for the CCP to solidify their position and increase their options for suppression.  But imagine different circumstances. Imagine a society leveraging data on the macroscopic level, everything from government records to online receipts, as is being done in China, and a comprehensive list of digital rights for consumer citizens.  The fusion of Pentland’s “Data New Deal” (Pentland 83) and the CCP’s social credit system might be the optimal template for the 21st century template.

Sources Accessed:


Should public schools with higher proportions of low-income students receive increased funding?

In 2016, the National Bureau of Economic Research (NBER) published a monumental study examining the measurable academic effects of increased school funding. Using individual student scores (instead of combined data from entire schools) on the National Assessment of Educational Progress exam, the researchers found that funding-increasing reforms “lead to sharp, immediate, and sustained increases in spending in low-income school districts [and] increases in the achievement of students in these districts, phasing in gradually over the years following the reform” (Lafortune, Rothstein, & Whitmore Schanzenbach, 2016).

The researchers contextualize their study in the “so-called ‘adequacy’ era,” referring to the shift in many states’ funding strategies following the Kentucky Supreme Court Case Rose v. Council for Better Education (1989). The case yielded requirements to adequately fund education in order for the state to fulfill the Kentucky Constitution’s provision for “an efficient system of common schools” (Education Law Center, n.d.). The decision prompted similarly equitable changes to the funding formulas for several other states’ K-12 public education systems (Education Law Center, n.d.). Because of this partial shift in funding ideologies, the researchers use it as the marker of the “equal funding” mindset’s transition into the current “adequate funding” one.

Despite Lafortune, Rothstein, and Whitmore Schanzenbach’s findings, a nationwide study from the Education Law Center and Rutgers Graduate School of Education on school funding by district poverty level concluded that “[t]he majority of states have unfair funding systems… that ignore the need for additional funding in high-poverty districts” (Baker, Farrie, & Sciarra, 2018, p. iv). The photo below is from an interactive map and shows data from the same study. The reality of education funding aligns with the model included in former President George W. Bush’ No Child Left Behind Act of 2001. In the speech he delivered before officially authorizing the legislation, he announced, “we’re going to spend more money, more resources, but they’ll be directed at methods that work. Not feel-good methods, not sound-good methods, but methods that actually work” (Strauss, 2015). The NBER found increased funding to be effective, but Bush based success on standardized test results, which are statistically and unjustly correlated with students’ socioeconomic statuses (Marcus, 2017). Considering this, it is unsurprising that Bush did not consider equitable funding to districts with high proportions of low-income students a “feel-good method.”

While it is important that researchers like these from the NBER publicize data-backed studies promoting equity in school funding, the disconnect between scholarship and practice is alarming. From a social justice standpoint, the education system’s fundamental role in students’ life trajectories makes it responsible for interrupting social reproduction, which describes the upper class’ persistent generational transference of wealth without more equal redistribution in society. Despite findings such as the NBER’s, Baker, Farrie, and Sciarra (2018) demonstrate that most states ignore the proven possibility of equal outcomes between districts and the ability of increased funding to combat outside social-political factors that low-income students face; these states’ decisions perpetuate social reproduction via the education system by failing to interrupt disparities between districts.

References

Baker, B. D., Farrie, D., & Sciarra, D. (2018). Is school funding fair? A national report card (7th ed.). Education Law Center & Rutgers Graduate School of Education. Retrieved from http://www.schoolfundingfairness.org/is-school-funding-fair/reports

Carey, K., & Harris, E. A. (2016, December 12). It turns out spending more probably does improve education. The New York Times. Retrieved from https://www.nytimes.com/2016/12/12/nyregion/it-turns-out-spending-more-probably-does-improve-education.html

Education Law Center. (n.d.) State profile: Kentucky. Retrieved from http://www.edlawcenter.org/states/kentucky.html

Lafortune, J., Rothstein, J., & Whitmore Schanzenbach, D. (2016). School finance reform and the distribution of student achievement. American Economic Journal: Applied Economics 10(2), 1-26. Retrieved from https://www.nber.org/papers/w22011

Marcus, J. (2017, August 16). The newest advantage of being rich in America? Higher grades. The Hechinger Report. Retrieved from https://hechingerreport.org/newest-advantage-rich-america-higher-grades/

Strauss, V. (2015, December 9). Why it’s worth re-reading George W. Bush’s 2002 No Child Left Behind speech. The Washington Post. Retrieved from https://www.washingtonpost.com/news/answer-sheet/wp/2015/12/09/why-its-worth-re-reading-george-w-bushs-2002-no-child-left-behind-speech/?utm_term=.15bc027b16a7

The Decline of Religion in America

White evangelical Protestants overwhelmingly voted for Donald Trump in the 2016 election. Their conservative, nostalgic beliefs aligned closely to his promises of a return to the ‘good ol’ days’ of the mid-20th century. But unable to usher in a younger generation, their numbers appear to be withering as the older generation dies and is not replaced. This decline in religious identity is strong with white evangelical Protestants, but it is also happening to many other large religious sects in America. A 2016
Public Religion Research Institute (PRRI survey) found that young Americans are leaving religion at an unprecedented rate. Many different sociological or economical explanations for this trend have been circulating, but does this study actually present a true picture of religion in America?

The PRRI study conducted in September of 2016 was picked up by the politically driven blog fivethirtyeight, which produced this chart depicting the generational shift in religious identity among americans, grouped by age and categorized by religious affiliation:

This graphic paints a clear picture in support of their argument that white evangelical Protestants declined by 18% between the youngest and oldest age groups polled. The two other white religious groups, mainline Protestants and Catholics, also showed a sharp decline in their followers in younger generations – while religiously unaffiliated Americans increased from 12% to 38%. But how do we know if this is a new trend, or if Americans have always become increasingly devout as they grow older? Perhaps the polling for this study was only conducted in urban areas with more progressive mindsets?

PRRI, the organization that conducted the study describes themselves as a
“nonprofit, nonpartisan, independent research organization.” Their staff is diverse in race, gender, and religious identity, and the organization is transparent in their partnerships and sponsors. The 2016 American Values survey from which fivethirtyeight’s graph came from was conducted for one month, sampled from “nationally representative adults (18+) living in the United States” and had a total of 2,010 repondants, both online and over the phone.


All PRRI public opinion research is based on probability sampling to ensure that results are broadly representative of the population of interest. All PRRI studies include bilingual (English and Spanish) interviewing. Telephone studies are conducted by professional interviewers and include a high proportion of cell phone interviewing.

PRRI.org

Another graph found in the analysis of the survey puts to rest any further scepticism in fivethirtyeight’s claim. PRRI found that 25% of Americans in 2016 are religiously unaffiliated, up from just 5% in 1972. This shows that the trend of decreasing affiliation is not just found between generations in 2016, but that there has been a larger trend from at least the 1970s that has progressively increased into the early 2000s.

This final piece of evidence shows that PRRI’s and fivethirtyeight’s claim of the precipitous fall of religious affiliation is true and representative of a wide variety of Americans. There are no blatant biases found in the data collection, and no misleading representations of the data presented. So what does this mean for the future of America? Will we become a more liberal nation as the older religious generation dies, or will religion cease to create political boundaries as it loses its base?

Today, one-quarter (25%) of Americans claim no formal religious identity, making this group the single largest “religious group” in the U.S.

PRRI.org

Sources:

fivethirtyeight:Are White Evangelicals Sacrificing The Future In Search Of The Past?
PRRI 2016 American Values Survey Data
PRRI About
PRRI The Rise of the Unaffiliated

80,000 Americans Died From Influenza Last Year? It’s Time to Rethink CDC Influenza Death Estimates.

While searching through Science and Health articles on Vox, I came across an article that caught my eye. In large bold letters across the screen the title read, 80,000 Americans died of the flu last winter. Get your flu shot. I thought to myself, wow! That many? In my circles I only know a couple people who even had the flu over the last year. How could this number be so big and where did it come from?

The article asserts that influenza last year claimed more lives than traffic accidents, gun violence, and opioid overdoses. It explains that due to the variability in virus types, flu vaccinations are not always as effective as they should be, stating that the effectiveness of immunizations against influenza A (H1N1) is 54%, influenza B, 67% and influenza A (H3N2), only 33%. This is where the problem lies with flu vaccinations. In years where influenza types H1N1 and B are the main strains, vaccinations have a good chance of being effective. However, in years where H3N2 is the dominate strain, like last year, flu vaccines are less likely to help. This is what the article claims could explain the high incidences of flu related deaths in the 2017-18 flu season.

Even with the vaccination explanation I still felt uncertain about the reported number of deaths, this 80,000, so I went to the CDC website, where the data originated from. I found a slew of information on influenza surveillance. The website indicates that influenza associated deaths are tracked through two systems. the National Center for Health Statistics (NCHS) mortality surveillance data and the Influenza-Associated Pediatric Mortality Surveillance System. The NCHS collects data from death certificates across the U.S. using different codes to identify cause of death. The CDC then uses the data on pneumonia and influenza (P&I) deaths to calculate a seasonal baseline. The other system monitors all confirmed influenza deaths in children, which is reported to the CDC. To calculate an estimate of influenza associated deaths in a given season the CDC uses a ratio of deaths-to-hospitalizations in their statistical model. I found it interesting that the website states they don’t just use P&I data, but a combination of other respiratory and circulatory causes (R&C) and other non-respiratory, non-circulatory causes of death, that are not specified on the CDC website. Even though it’s stated that they use all these categories the only graph I could find shows data from the P&I category only (see graph below). I found this really confusing and furthermore why do they combine so many causes of death to estimate flu deaths? The CDC claims that “deaths related to flu may not have influenza listed as a cause of death” and “seasonal influenza may lead to death from other causes, such as pneumonia, congestive heart failure, or chronic obstructive pulmonary disease”. But association does not imply causation. How can they be so sure that so many of the cases from these other causes of death are related to the flu? Surely many deaths from congestive heart failure and pneumonia are not due to influenza. I’m no statistician, but this seems like a formula for biased data. Lumping all of these deaths together is seriously misleading and a gross overestimation in my opinion.

Source Centers for Disease Control and Prevention

I found other things problematic as well. Throughout the CDC’s webpages on flu data, the terms “influenza associated deaths” and “influenza deaths” seem to be used interchangeably. This too can be misleading as seen in the title of the Vox article. 80,000 Americans did not die from the flu alone last year, they died from flu associated deaths, which may not all have actually been due to the flu. In fact, there were only 54,982 influenza positive tests reported to CDC by Public Health Laboratories, National Summary, which further exhibits how the numbers just don’t add up.

The issue at large here is that when the CDC releases information, the majority of the American public is going to believe and trust in what they say. It is important that the data they use and publish is unbiased and not misleading because it will be repeatedly used and referenced. This data is widely used and accepted. Not only does it affect what people think and the health choices they make, it has the possibility to effect the medical industry and public health policy as well. I’m not trying to say that the CDC is fudging numbers and using scare tactics to get people to vaccinate or is in cahoots with pharmaceutical companies. However I find their use of data to be irresponsible and ambiguous. Perhaps with some rewording on their website and changes to what data they use in determining deaths from influenza, misleading articles such as the one posted on Vox won’t be put out there to misinform the public.

References

Belluz, Julia. “80,000 Americans Died of the Flu Last Winter. Get Your Flu Shot.” Vox.com, Vox Media, 20 Dec. 2018, http://www.vox.com/2018/9/27/17910318/flu-deaths-2018-epidemic-outbreak-shot

“Influenza (Flu).” Centers for Disease Control and Prevention, Centers for Disease Control and Prevention, 19 Oct. 2018, http://www.cdc.gov/flu/weekly/overview.htm

“Influenza (Flu).” Centers for Disease Control and Prevention, Centers for Disease Control and Prevention, 25 Oct. 2018, http://www.cdc.gov/flu/about/burden/how-cdc-estimates.htm.

“Influenza-Associated Pediatric Mortality.” Centers for Disease Control and Prevention, Centers for Disease Control and Prevention, gis.cdc.gov/GRASP/Fluview/PedFluDeath.html.

“National Center for Health Statistics Mortality Surveillance System.” Centers for Disease Control and Prevention, Centers for Disease Control and Prevention, gis.cdc.gov/grasp/fluview/mortality.html.

“National, Regional, and State Level Outpatient Illness and Viral Surveillance.” Centers for Disease Control and Prevention, Centers for Disease Control and Prevention, gis.cdc.gov/grasp/fluview/fluportaldashboard.html.

Can AI replace humans in developing art in all forms?

There’s an ethical question posed when artificial intelligence is programmed to create art. Yes, they do have the ability. Yes, various experiments have been conducted on audiences asking whether they can distinguish AI generated art from human generated art, usually through a form of the Turing test, and the consensus being that it’s hard to determine. Yes, (though subjective) people find that AI generated art is just as relevant, important, or aesthetically pleasing as art created by humans. But the question that arises is that is it possible for artificial intelligence to replace all humans in developing every form of art?

AI can be programmed to create paintings based off of images of art throughout multiple centuries, and can even develop music when fed information about famous composers. The team that designed Aiva, an AI classical composer, described how they taught the algorithm to compose music, “We have taught a deep neural network to understand the art of music composition by reading through a large database of classical partitions written by the most famous composers (Bach, Beethoven, Mozart, etc). Aiva is capable of capturing concepts of music theory just by doing this acquisition of existing musical works.” AI has been proved to be able to create aesthetic products from analyzing and identifying patterns from preexisting material, however, there are things that AI might be isolated from that have a huge influence on humans. Ahmed Elgammel, director of the Art and Artificial Intelligence Lab at Rutgers University, has been experimenting with CAN, another AI visual art creator. Elgammel even says about his own experiments that art boiled down to its essence, creation, is achievable by AI and perhaps even in some cases the product can be better than human creation. However, he describes variables that do not influence AI the same way it impacts humans, “But if you define art more broadly as an attempt to say something about the wider world, to express one’s own sensibilities and anxieties and feelings, then AI art must fall short, because no machine mind can have that urge — and perhaps never will.” Humans simply have a will to create art that AI does not.

Another area where AI falls short is the ability to create in space. Artificial intelligence has the ability to create music, paintings, poetry, and even choreography, however these merely exist in time, only in the digital world, not in the physical. Art is more than the ability to create and develop a product based off patterns and variations of those patterns; humans have more than the ability to create and develop a product, they also have the ability to perform their own works. While some art forms don’t necessarily need a body to be created, the act of performance in the physical world needs a body. AI generated choreography has been achieved, and it uses footage of movement to recognize patterns to create movement in a virtual simulation. However the AI will never be able to perform the work the same way a human would be able to. Unless our technology advances enough to give AI a body that has the exact same motor functions and capabilities as humans, AI will never reach the wholistic realization of an artist.

Artificial intelligence lacks the mind-body connection that humans have, and their ability to use their sensorimotor engagements to absorb new information from engaging with the world. When computer scientists feed information to AI, such as famous paintings, composers and their music, words from books, movies, articles, and poems, the AI are using preexisting material to create a product. This is a singular variable in the human experience of art making. The presence of the mind and it’s complexities (consciousness, the ability to make decisions, the ability to have intersubjective realities or to imagine, etc.), are biologically and physiologically tied to our bodies. Mark Johnson, a philosopher and professor at the University of Oregon, confirms this theory, “What we call ‘mind’ and what we call ‘body’ are not two things, but rather aspects of one organic process, so that all our meaning, thought, and language emerge from the aesthetic dimensions of this embodied activity. Chief among those dimensions are qualities, images, patterns of sensorimotor processes, and emotions.” AI being given the ability to create, just as the human mind, doesn’t also give it the ability to have consciousness, make decisions, and have imagination, which are variables tied to the human mind in the act of creating art.

While there are some things that AI generated art can achieve, an aesthetic product for example, there are some things that it also fails to achieve: an urge to create art stemming from emotional afflictions in an imperfect world, influences from sensorimotor engagements developed from a body that interacts with the world, capability to perform in some art forms. AI can create an aesthetically pleasing product, but it can’t create art. At least, not in the sense that humans make art. We can program AI to create an aesthetically pleasing product in various forms, but human art is born out of an imperfect world, one where humans are emotionally and even mentally affected by it, and are urged to use art to define it through various lenses, make commentary on the world, and connect others through a shared experience. Unless AI can be given the same capabilities that humans have, such as having a fully functional body with sensory devices, and a mind that experiences consciousness, imagination, emotions, without being programmed to create, there will never be an AI that can replace humans in developing art.

Works Cited:

Kaleagasi, Bartu. “A New AI Can Write Music as Well as a Human Composer.” Futurism, 9 Mar. 2017, https://futurism.com/a-new-ai-can-write-music-as-well-as-a-human-composer.

“Is Artificial Intelligence Set to Become Art’s Next Medium?” Christie’s, 12 Dec. 2018, https://www.christies.com/features/A-collaboration-between-two-artists-one-human-one-a-machine-9332-1.aspx.

Robitzski, Dan. “Artificial Intelligence Writes Bad Poems Just Like An Angsty Teen.” Futurism, 26 Apr. 2018, https://futurism.com/artificial-intelligence-bad-poems.

Stahl, Jennifer. “Is AI Choreography the Next Big Thing?” Dance Magazine, 11 Jan. 2019, https://www.dancemagazine.com/is-google-the-worlds-next-great-choreographer-2625652667.html?rebelltitem=3#rebelltitem3.

Johnson, Mark. The Meaning of the Body, Aesthetic of Human Understanding. Chicago, The University of Chicago Press, 2007.

Doodling or Fidget Spinners: Who would win?

People doing something with their body/fingers while trying to concentrate on something has been investigated for a long time, particularly during a period of my childhood. This time period, which I’d consider to be around 2007-2012, many doctors/therapists seeing me were insistent on me exhibiting symptoms of ADHD because of my spacey-ness, so to speak. It’s not that I was doing poorly in school- in fact, my grades were more than satisfactory. I just had the tendency to draw on everything- my homework, my notebooks, my body, anything that a marker could reach. Rather than suspecting that I was an artistic prodigy, my parents sought answers to a possible attention deficit.

That said, why are we so fast to align compulsive doodling with an attention disorder, yet normalize other types of fidgeting, such as fidget spinners or cubes? And why are students often punished for doodling on themselves or assignments to (advertently or inadvertently) help them focus? The data I looked at actually supports that doodling increases attention capacity- however,  there might not be adequate or enough data in the media to support this claim because unlike fidget spinners, doodling can’t be significantly profited off of.

The first step in processing this would be establishing that doodling actually does increase attention capacity and thinking about the sources that suggest this. An article published by Harvard Medical School discussing doodling related to attention capacity writes about a particular experiment: “In 2009, psychologist Jackie Andrade asked 40 people to monitor a 2-½ minute dull and rambling voice mail message. Half of the group doodled while they did this (they shaded in a shape), and the other half did not. They were not aware that their memories would be tested after the call. Surprisingly, when both groups were asked to recall details from the call, those that doodled were better at paying attention to the message and recalling the details. They recalled 29% more information!” Does this data sufficiently conclude that doodling can demonstrate not only a correlation but causation of increased memory? Not only is this a pretty reputable source but the experiment seems to be reliable in having both a control and variable, where the only distinction between the two was whether or not they’d been instructed to doodle.

Say for the sake of this argument that doodling does increase focus/attention capacity. What about the second half of the claim: is doodling actually demonized because it’s inherently almost impossible for big business to profit off of? This nice graphic from The Economist represents how huge Fidget Spinners boomed within the “toy” industry:
20170909_WOC604.png

Fidget spinners became over 20 percent of all toy sales at one point in 2017. Another source, Fox Business reports that fidget spinner sales could amass approximately half a billion dollars in revenue. It’s no wonder that these things are normalized opposed to doodling. Doodling doesn’t require anyone to feed into consumerism, only hardly if at all- so that would explain why big business would want you to believe that fidget spinners are more effective.

Following that, what kinds of data does big business have control over? After all, how likely are we to see many investigations on the impact of doodling on concentration (especially ones with a positive conclusion) when studies can be done for something that can be easily profited on? From the research presented thus far, it seems like we can conclude that doodling at least has been demonstrated to help improve attention capacity. Is it possible that the data isn’t all-covering due to the nature of its marketability? Yes.
Sources:

https://www.health.harvard.edu/blog/the-thinking-benefits-of-doodling-2016121510844

https://www.economist.com/graphic-detail/2017/09/08/the-fidget-spinner-boom

https://www.foxbusiness.com/features/the-500000000-trend-spinning-the-toy-industry-upside-down


Food Corporations Lack Concern Over Rising Obesity in the United States

Much like their counterpart big tobacco, giant food corporations such as Coca Cola and Nestle perpetuate problems relating to obesity and heart disease. But, why does this happen? Their distracted agenda is to help Americans consume less and live healthier lives by providing research money in studies, when in fact, their underlying objective is their quest to make a profit. This is deeply detrimental to American people’s lives because food corporations’ agendas lead Americans into believing that their products are a healthy choice.  

While most Americans know that smoking cigarettes increases risk for cancer, big tobacco companies are getting better at hiding the fact that they still are selling carcinogens in new styles and flavors. Juul is a great example of a hazardous product that is popular among young adults. The same is happening with the food industry. As new evidence plasters headlines indicating a link between sugary drinks and obesity linked diseases, the companies must fight back. Companies such as Coca Cola invest their money into creating low-calorie, zero sugar, “better for you” soft drinks, and put more time into funding research that concludes “Americans should be more concerned with exercise than diet to maintain health” (Reilly). This is a big theme among company giants. They supply information to people with evidence from research studies, that they (big companies) have funded. Large companies like Coca Cola support the individual idea that “it’s your fault if you’re obese, not soda’s”. They also promote living a healthy active life while exercising, but diet is not as important. Because companies such as Nestle own a lot of other companies like Gerber baby food and Powerbar, they have a lot of impact on consumer choices.  Food giants support the idea of living a healthy and active life, and that calorie counting is not as important. This image shows a couple major companies that own most used products in everyday life.


Food giants are shaping consumer’s minds about what choices in the supermarket are healthy. People rely on the common idea that companies value the public’s health. Whereas the harsh reality is that these companies’ bottom line is earning a profit. For example, if Coca Cola stated that Coke is actually harmful, it would negatively affect their profit. It is much more cost effective to add “zero sugar” on a label even though it does not improve the nutrition of that product. Nevertheless, there continues to be a rise in obesity rates and chronic disease relating to obesity rates in the United States. This graph shows the rising obesity rates in the United States for men and women starting in 1960. The trend continues to grow, despite the new healthy soda and nutritious cookies that are out on the market.


It is not a coincidence that food corporations are gaining profit and obesity rates are still inclining. Money is the underlying theme in the bridge between what consumers hear is good for them, and what these companies want them to hear. Food corporations are not concerned with the “obesity epidemic”. The data concludes that large companies have more of a priority in continuing to sell product, rather than reducing the risk of chronic disease in consumers.

References:

https://www.niddk.nih.gov/health-information/health-statistics/overweight-obesity

https://www.insidephilanthropy.com/home/2018/1/5/food-companies-manipulation-of-nutrition-research-takes-root-abroad


https://well.blogs.nytimes.com/2015/08/09/coca-cola-funds-scientists-who-shift-blame-for-obesity-away-from-bad-diets/

https://www.huffingtonpost.com/2012/04/27/consumer-brands-owned-ten-companies-graphic_n_1458812.htmlh

\