The Whole Foods Market in Sugar House stocks thirteen different brands of milk alternatives. The options include: soy, almond, coconut, cashew, rice, hazelnut, macadamia nut, pecan, flax, hemp, banana, and pea. The options for milk alternatives far outnumber the dairy product options. In the last year, plant-based food sales have increased by 20% (Nielson, 2018). This is largely the result of the enormous presence of vegans and vegetarians in the media. Social media platforms such as Facebook and Instagram are filled with users sharing meat free recipes. Food blogs, cookbooks, and television shows preach concerns about health implications, animal treatment, and environmental impact of meat heavy diets. With the extended media coverage, one would expect an increasing number people with plant based diets. How does the actual number of vegans and vegetarians in the U.S. compare to their social presence?
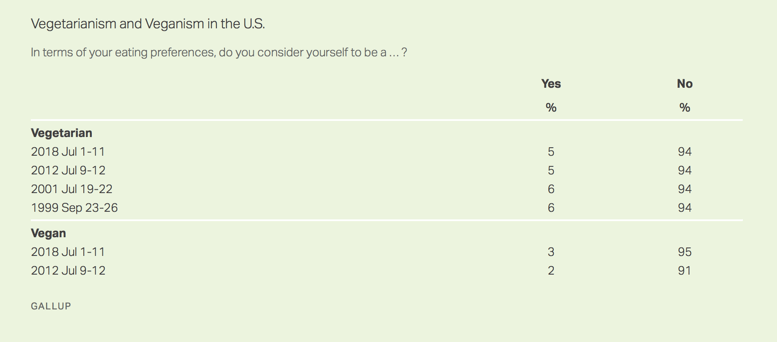
On college campuses especially, topics about the social implications of food choices are discussed constantly and almost all events on campus offer vegan food options. However, a recent Gallup poll suggests that despite the constant media coverage, this may not be the norm. In a 2018 telephone survey, people self reported that they were vegetarians only 5% of the time compared to 6% in 1999 (news.gallup.com). Despite recent media coverage and food science advances in meat alternatives, rates have remained steady and even decreased in the last 17 years.
There is a common trope of vegans and vegetarians being particularly outspoken about their diet choices. This could partially account for their overwhelming media presence. In addition, opponents to meat-free lifestyles berate veganism for threatens the status quo and frequently engage in discussion in public forums, which further increases the perceived presence. Despite the fact that more information and pressure is present than ever before, the rates of vegetarianism and veganism have remained relatively steady. A reason for this could be that many people are “flexible” in their abstinence from meat, and thus may not fully identify as vegetarian. Meatless Mondays and flexitarian diets should also be considered. A further study could look into the qualifications are for people to give themselves the title of vegetarian.
References
Gallup, Inc. (2018, August 01). Snapshot: Few Americans Vegetarian or Vegan. Retrieved from https://news.gallup.com
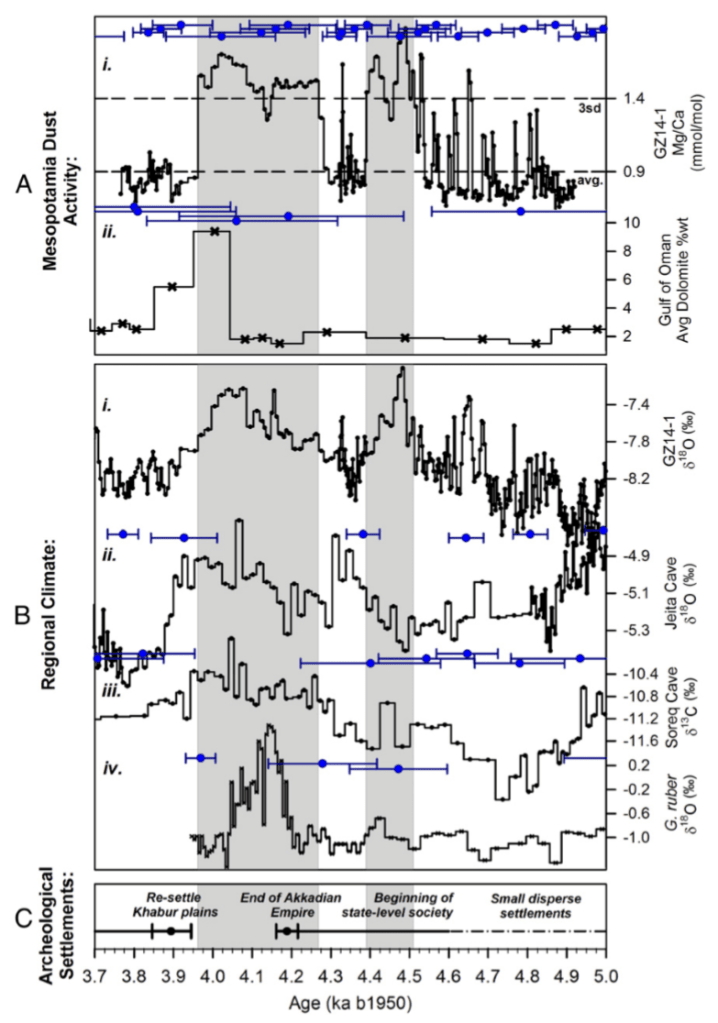
The results of the teams research are established through marine samples from the northern read sea and the Gulf of Oman, and stalagmite core samples (GZ14-1) from Gol-e-Zard Cave. These separate analyses were then synthesized into a comparative chart, posted below. The team compared their geographic and geologic “dust activity” results and regional climate patterns with existing archaeological findings regarding Mesopotamian settlements to show that the height of the Akkadian empire occurred when dust activity was lowest, and when drought conditions returned, the empire declines.
Graphical representation of the evolution of rain-fed agricultural settlements in north Mesopotamia, which became urbanized around 4.5 ka, were imperialized by Akkad around 4.26 ka, and then were suddenly abandoned at 4.19 ± 0.018 (1σ) ka (17), coincident with the decline of the Akkadian empire
The inverse relationship established by the researchers is further enforced by written evidence from the Akkadians themselves. In the Curse of Agade (Akkad), striking passages highlight the effects climate had on the success of the empire, and also shows that the people were aware of the effects of changing climate on their lives, because climate change has a direct impact on the production of food. So much so, that the effects of changing climate are personified as gods in the literary source.
the large arable tracts yielded no grain, the inundated fields yielded no fish, the irrigated orchards yielded no syrup or wine, the thick clouds did not rain (149-175)… May [Naram-Sin’s impiety] make the city die of hunger! May your citizens, who used to eat fine food, lie hungry in the grass and herbs (245-255)
Despite the research of the team, there is still skepticism regarding the causal relationship between climate change and ancient empire collapse. Karl W. Butzer wrote inCollapse, environment, and society, that “collapse is multicausal and rarely abrupt… Undue attention to stressors risks underestimating the intricate interplay of environmental, political, and sociocultural resilience in limiting the damages of collapse or in facilitating reconstruction.” While then we should restrain applying the causal relationship between climate change and empire collapse to all Old World cases, we certainly see that the case of the collapse of the Akkadian empire is an example of environmental cause-and-effect.
There is often a popularized notion that history is a devalued subject, worth nothing to those of us in the present. We see, in our modern age, the technological luxuries which ease the suffering of life and see history as floods of barbarians with no notions of the subjects which provide us comfort. This is simply not the case. Akkad was an advanced empire, spanning across the central middle east, with compex organization, trade networks, irrigation systems, and organized writing and information distribution. Akkad is in fact similar to modern empires, and we should take the wise advice of history- climate change can collapse even the mightiest empire because, without regard to other effects, we all need to eat.
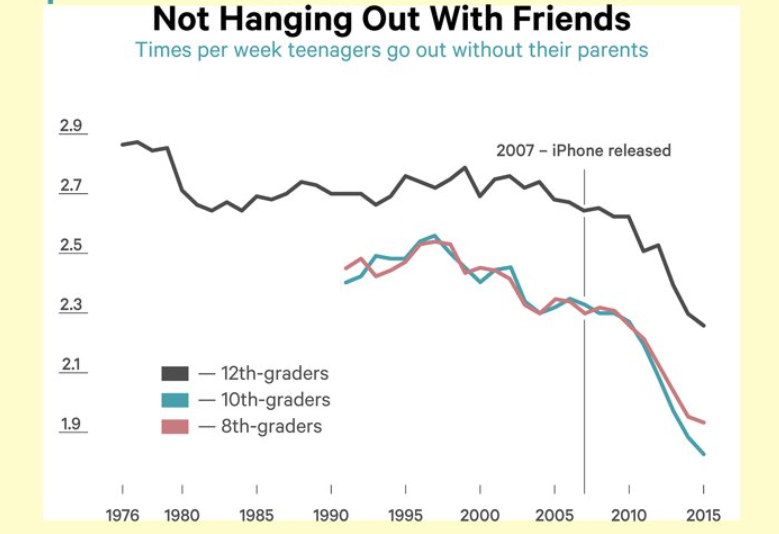
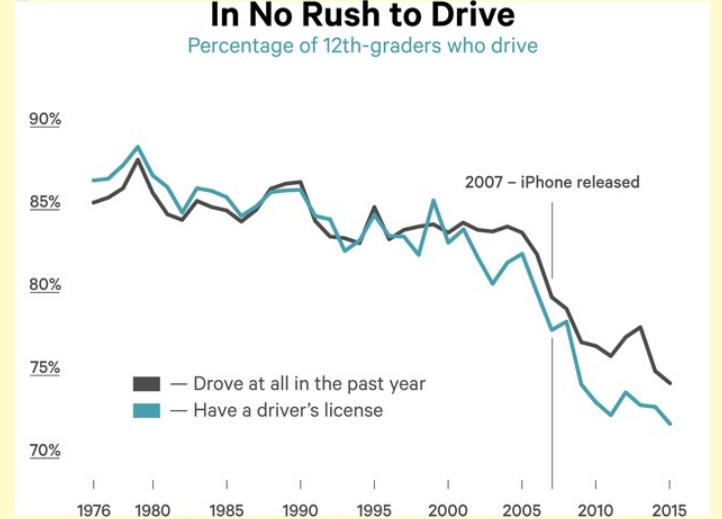
In 2012, more than 50% of Americans owned a smartphone and teen depression rates have drastically been on the rise since 2011. Unsurprisingly, multiple studies have focused on the “iGen” (those born between 1995 and 2012–per Twenge, 2017) and followed the trends of increased screen time and teenage depression rates. Jean Twenge explains in her article“Have Smartphones Destroyed a Generation?”that there is a stark positive correlation between these two variables. It would seem, then, that to decrease teens’ likelihood of experiencing depression, they should also decrease their screen time. Unfortunately, the solution to alleviating teen depression is far more complex than simply turning off their cell phones, and Twenge creates causations from her data that are most likely just correlations and patterns that need a more in-depth analysis.
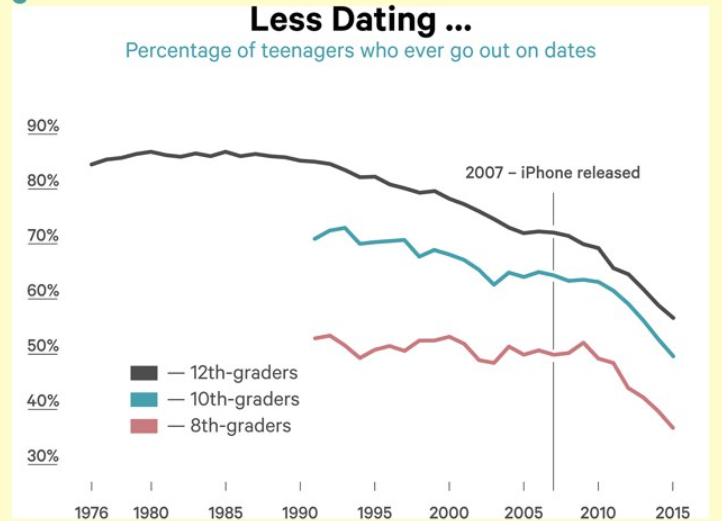
Twenge draws connections between screen time and teen depression by noting the three following trends (also depicted in the graphs above): “12th-graders in 2015 were going out less often than eighth-graders did as recently as 2009″, “..only about 56 percent of high-school seniors in 2015 went out on dates; for Boomers and Gen Xers, the number was about 85 percent” and that one in four teens lack a drivers license by the time they finish high school (Twenge, 2017). Essentially, teens today are single, staying home, aren’t driving anywhere, and are horridly depressed. Although the statistics provided are interesting, they do not analyze the crux of the problem, and merely hope that the numbers will provide a valid-enough argument to make the case that phone time leads to depressive teens. The overarching conclusion is that “Teens who spend three hours a day or more on electronic devices are 35 percent more likely to have a risk factor for suicide, such as making a suicide plan” (Twenge, 2017) and further categorizes risk factors into gender and age groups. Although this data shows relevant trends that need to be addressed, unfortunately analysts like Twenge are chasing parked cars and spewing data that is already well-known, without delving into the real issue.
Brian Resnick of Vox addresses the lack of conclusive evidence of studies linking tech use and teen depression, by reminding readers that the data right now is inconclusive and warrants further inquiry, but not a doomsday narrative.
“Studies like these are rife with such caveats, and more. In general, such studies do not asses causality, they do not include clinical assessments of mental health (just questionnaires), they somewhat arbitrarily define what counts as well-being, they rely on self-reports, and they often use “screen time” or “electronic device use” as a catchall variable to include any type of media use”.
Resnick, 2019
One problem with the question of teen depression and screen time, is in the question itself. What is screen time? Researches like Twenge use ‘screen time’ as an overarching variable that encompasses: reading, writing, studying, social media, etc. which is a complex variable that needs to be delineated to draw a more direct conclusion. There are also not plausible, effective methods for monitoring screen time without a breach of privacy or accounting for frequent user-reported errors such as reporting that they spent time reading news instead of scrolling through Facebook.
Finally, defining a subjective variable such as depression is incredibly difficult and can alter results based on the definition. In the Twenge study, suicidal factors were determined by whether participants ‘felt depressed for more than two days in a row over a two week time period’ instead of reported suicide attempts, for example.
The correlation between screen time and teen depression is a question that is more than worthy of significant inquiry. However, we must also question what and who is on the screen that is making such a negative impact on our youth population, instead of demonizing the smartphone industry and screen time as a whole. For now, the data needs more work and teens (and the general population) should be aware of factors within their screen time that may induce negative feelings.
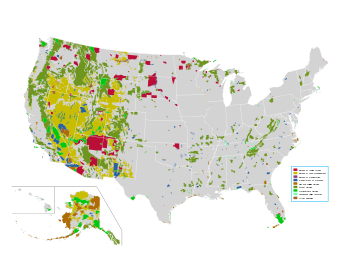
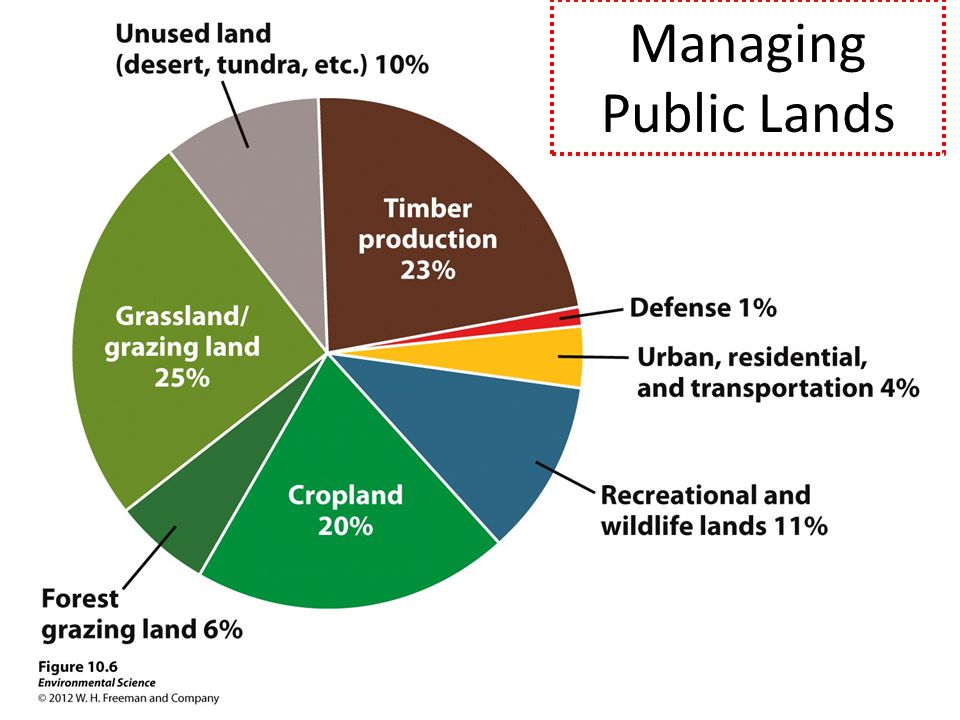
Public lands are all around us, particularly in the west. Figure 1 below maps out the “public lands” available in the united states, and Figure 2 presents the uses of those lands by percentage.
Figure 1
Figure 2
Public lands is defined as “thepublicdomain,unappropriatedlandbelonging to thefederalgovernmentthat is subject to sale or otherdisposalundergenerallawsand is notreservedforanyparticulargovernmental or publicpurpose.” from legal-dictionary.thefreedictionary.com. Basically, it’s just the land that’s federally owned. These lands are often a subject of politics- for instance, the debate about Bears Ears National Monument boundaries being shrunk. Particularly for residents of Utah as well as other western states, public lands are a prominent topic because they make up so much of the place we call our home.
An interesting question about public lands is posed in the article “How 1,600 People Went Missing from Our Public Lands Without a Trace” by Jon Billman. Throughout, he tells the story of a young student named Joe Keller, and the story of his disappearance in a national park and the process of searching for him. In other chunks of the article, Billman speculates why people go missing and details how the process of searching for them desperately needs amended.
I think there are a few important questions to ponder about this information and about the data released by the BLM and National Park Services: why is nothing being done about all of these missing people? Why aren’t we hearing about this? What are the possible motives?
David Paulides—founder of the CanAm Missing Project and author of Missing 411 Hunters: Unexplained Disappearances— is quoted in the article. “He believes the Park Service in particular knows exactly how many people are missing but won’t release the information for fear that the sheer numbers—and the ways in which people went missing—would shock the public so badly that visitor numbers would go down.” The article accounts for 1600 “missing people” as a conservative figure- there’s hundreds if not thousands of people missing on public lands, often having their bodies only to be recovered months and years later, if ever recovered at all.
The article also details the legal aspects of missing persons, and what that entails. Billman writes “‘There are no federal standards for terrestrial search and rescue,’ Koester says. ‘Very few states have standards. A missing person is a local problem. It’s a historical institution from when the sheriff was the only organized government.’ And when it comes to the locals riding to your rescue, Koester says, ‘There’s a vast spectrum of capability.’” This would highlight another possible agenda for the federal government and NPS withholding information on the missing people within the realm of their areas- there’s no legal sanctions requiring that they report it. Therefore, if, as Paulides speculates, they withhold information for fear that the number of visitors would decrease, it would make sense. They’re not only federally funded lands, but receive financial resources from tourism for both the parks and communities. Search efforts are local, according to old-time law as noted in the previous quote.
There’s the economical argument for the withholding of information- the cost to benefit ratio seems to suggest that it makes more sense. However, that does not consider the ethics. Is it morally correct to withhold from millions of people the real risk of becoming a missing person while visiting national parks? Although still a very low number, the economic thinking behind not releasing this data seems to reflect the general attitude of America as whole. By looking at the motives behind why certain data is released and why some is not, we might be able to build a better idea of American people’s intentions with data and key reasoning behind their use of it.
Recently I’ve found myself becoming more and more interested in how to conduct non-biased, objective research. My interest stems from my academic and career goals to conduct research one day. While I consider honesty of very high importance especially in research, I also realize that even the most honest researcher can fall victim to their very own cognitive biases. Unconscious influences can result in self-deception which in turn affects how even the best scientist analyzes his or her data. This is important because misinterpreted data can result in long-term consequences for the representative scientific community. In the article How Scientists Fool Themselves – and How They Can Stop Regina Nuzzo discusses cognitive biases that can have an impact on the analysis of data. She opens the article by telling the story of Andrew Gelman, a statistician who had a wrong sign on one of his variables, but because the results seemed reasonable he didn’t go back through his data and check it. He published his work and some years later when a graduate student discovered the error, Gelman had to publish a correction stating that the findings were essentially wrong. There’s no way of knowing how many people read his original study and never saw the correction. This just goes to show how important producing objective research is because once data is out there for all to see you can’t really erase it. With it being so easy for the brain to fool researchers how can biases be reduced to preserve objectivity and publish reliable data?
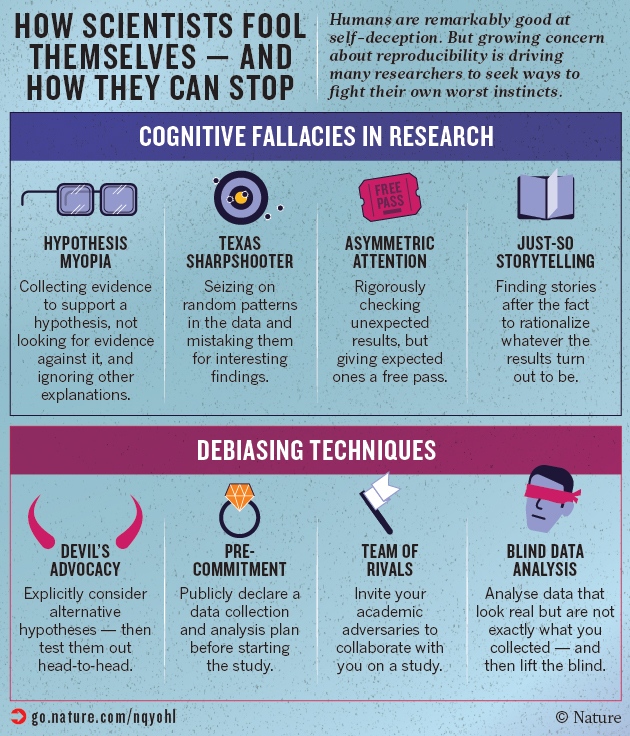
The first part of a solution to this problem is to acknowledge that no one is exempt from cognitive bias and to understand what biases are at play when analyzing data. According to Nuzzo, there are four biases that can cause one to misconstrue the results of research. Hypothesis myopia is when researchers become so focused on supporting their hypothesis by collecting evidence that they fail to consider refuting the evidence and alternative explanations. I think the issue with this is fairly clear. When we fail to consider other explanations we create one-sided stories that could be proliferated and have the potential to affect the literature of a topic. Nuzzo explains that the next bias is, “illustrated by the fable of the Texas sharpshooter: an inept marksman who fires a random pattern of bullets at the side of a barn draws a target around the biggest clump of bullet holes, and points proudly at his success.” This cognitive bias causes researchers to ignore the big picture and focus on the “most agreeable and interesting” results. Examples of this bias at play happen in p-hacking (exploiting degrees of freedom until p<0.5 is reached) and something called HARKing (Hypothesizing After the Results are Known). The next bias is asymmetric attention to detail or disconfirmation bias. As seen in the case of Andrew Gelman, this bias happens when non-expected results are scrupulously checked over, but “reasonable” results receive little scrutiny. It surprises me to find out how common this is. According to Nuzzo:
“In 2011, an analysis of over 250 psychology papers found that more than 1 in 10 of the p-values was incorrect— and that when the errors were big enough to change the statistical significance of the result, more than 90% of the mistakes were in favour of the researchers’ expectations, making a non-significant finding significant.”
This really goes to show how often this occurs and how important it is to overcome this bias. Last, but not least is just-so storytelling. This is when researchers construct a narrative to rationalize their results after the results are obtained. As Nuzzo explains, the issue with this is that a researcher can use these stories to support “anything and everything” when used in this way.
As stated by Nuzzo each bias represents a trap in which the science of identifying salient relationships is accelerated. She states that the key to avoiding these traps is to “slow down, be skeptical of findings and eliminate false positives and dead ends”, in essence, use the brakes. As the image below shows, the article poses a wide variety of techniques that a researcher can use to prevent these fallacies from interfering with how researchers look at data. Using a technique called strong interference in which researchers develop experiments to rule out alternative hypotheses and explanations, can combat hypothesis myopia. In order to do this one must first gather alternative explanations. In my eyes looking at competing hypotheses is a no-brainer and any thorough researcher would do this, however, with our brains looking for easy answers it’s easy to see how this still continues to occur. The next solution presented in the article is transparency and open science. Researchers have a lot of leeway when it comes to analyzing and presenting their findings. This method encourages researchers to share all of their methods, data, computer code and results so that others can analyze and confirm research findings. This ensures that what a researcher finds really conveys what the data indicates. Another way of collaborating with others to avoid bias is by working with researchers that hold opposing views. According to the article when talking about this, Daniel Kahneman states, “You need to assume you’re not going to change anyone’s mind completely, but you can turn that into an interesting argument and intelligent conversation that people can listen to and evaluate.” This technique seems like it could be the most useful technique mentioned in the article. Hypothetically the competing researchers would cancel out or reduce the effect of hypothesis myopia, asymmetric attention, and just so-storytelling. The final comment on how to avoid bias consists of using a program to produce alternative data sets which are all analyzed alongside the real data in a process called blind data analysis. The actual results are not revealed until the researcher completes the analysis. This method appears as one of the best methods because researchers are blind to the actual data so they have no way of knowing if the data is significant or not during analysis. In doing this biases are kept at bay and objectivity remains intact.
Insight into these fallacies offers a glimpse into the many biases people use to make decisions. These biases in research have the potential to distort the information available to scientists which informs future research and scientific debates. Learning about these fallacies not only gives me real-world examples of how cognitive biases could one day affect my work but what I can do to overcome them. I can’t stress enough about the importance of applying these techniques in my research so that it is not only objective and transparent, but reproducible. While we can’t get rid of the inherent bias we carry with us, these methods offer a good start to ease the damage they can cause to research, scientific data, and a researchers reputation.
“Science is an ongoing race between our inventing ways to fool ourselves, and our inventing ways to avoid fooling ourselves.”
Saul Perlmutter, astrophysicist at the University of California, Berkeley
References Nuzzo, Regina. “How Scientists Fool Themselves – and How They Can Stop.” Nature, vol. 526, no. 7572, 2015, pp. 182–185., doi:10.1038/526182a.
Utah House Bill 320 would have banned any plastic bag or “auxiliary container” regulation for the state of Utah. The bill was not passed, but it did spark a conversation around the idea of reducing the rights of cities and counties within the state after Moab and Park City enacted plastic bag bans. In 2014, California became the first U.S. state to ban plastic bags, and across the globe plastic bag bans or fees have been implemented since 1990. Plastic producers have lobbied hard to save the plastic bag, and in the past decade many bag bans have been repealed due to the convenience they provide and a ban’s perceived detriment to small retailers. Overall, plastic bags make up a relatively small amount of our plastic waste stream by weight, so does any of this plastic bag legislation actually have an environmental impact?
Plastic bags only make up about 12% of America’s plastic but they take up to 1000 years to decompose and present many environmental problems. Unlike many other plastics now, plastic bags are rarely recycled since they cause problems with the machinery, and even where they are recycled, people are often unaware and don’t recycle them. Once they are disposed of, plastic bags can be carried by wind across long distances, and are easily caught in plants and trees where they can become dangerous to wildlife. Recently, dead whales have been washing ashore with stomachs full of plastics, including dozens of plastic bags. Plastic bags are not only highly visible signs of our waste stream, they also are detrimental to ecosystems.
So can we change the amount of plastic bags that are floating and flying around? A 25 year study that was published in July of 2018 in Science of the Total Environment has presented some of the first evidence to show that bag bans can positively impact the environment. The study was conducted using trawls in specific areas from 1992 to 2017 along the coast of the United Kingdom and it looked at all plastic and fishing waste. Of the categories of plastic that were specified in the study, all showed an increase in abundance throughout the 25 years except plastic bags in the Greater North Sea (GNS) which had a “statistically significant downward trend in both the inshore (p = 0.05) and offshore (p = 0.01) regions”.
The left scatterplot (a) depicts the percentage of trawls containing plastic bags for all three areas of the study by year from 1992-2017. It shows a significant downward trend for both inshore and offshore GNS.
The authors of this study attributed the negative trend in the GNS to plastic bag legislation in Ireland and Denmark in 2002 and 2003. It was reported that plastic bag use was reduced by 90% in Ireland due to a fee placed on them with a similar trend in Denmark the following year. Nearly a decade later, there appeared to be a dramatic reduction in the amount of plastic bags found in the point-samples of the trawlers with averages before 2010 in separate parts of the GNS at 43% and 53%, and post-2010 averages at 16% and 21%. The authors suggested these results show that “behavioural and legislative changes could reduce the problem of marine litter within decades.” Assuming that the results of this study are accurate, we might begin to see a significant reduction of plastic bags off California’s coast around 2024. San Jose, CA who implemented a bag ban in 2011 conducted a much smaller inland study and found a reduction of “approximately 89 percent in the storm drain system, 60 percent in the creeks and rivers, and 59 percent in City streets and neighborhoods.”
As more plastic bag legislation nears its 10 year mark, we may begin to see studies showing the long term effects that legislation can have on the environment. Using these two studies as proxies for other areas that have enacted bans, we so far can see that bag legislation can reduce the amount of plastic in our oceans, streets, and waterways, leading to cleaner communities. Although plastic bags only make up 1/12 of our waste stream, they are a visible reminder of how much plastic we use everyday and where it can end up. Hopefully the U.K. study will serve as an incentive to coastal states and cities to implement their own plastic bag legislation so that we can see cleaner oceans in another 10 years.
Many areas of our lives are heavily influenced by technology. It impacts how doctors look at a patient’s body, how people avoid traffic in the city, how we spend our down time at home, how we communicate with friends and family across long distances, etc. Technology itself is already prevalent in art forms already, however, art has begun to embrace technology to change the process and structure of itself.
New art forms are dawning out of technology. Technology has started to become deconstructed and thought of less as just a utility, and more as something that can be aesthetically beautiful, abstracted and thought of philosophically, and turned into something for pleasure and admiration. Alison Craighead of the artistic partnership, Thomson & Craighead, discussed technology as an art, “We were thinking, ‘Well, if data is our material, can we draw with it?” Jon Thomson added, “Decorative Newsfeeds is an automatic drawing. So it’s a kind of endless animation that uses syndicated news headlines the RSS feeds, and then takes a news feeds at random and displays it on screen according to a set of rules.” Nowadays, we often see film, animation, technology as sculptures and light paintings and mural, among many other things in the most famous museums such as the MoMA, Guggenheim, LACMA, and more. Technology is at the forefront of artistic creation, and artists must learn to embrace it and experiment with it to develop new forms of art.
Not only can technology in itself be an art form, it can also transform the way others are structured and experienced. Andrew Winghart, an emerging choreographer, directs and choreographers dance for the camera. Whereas stage/concert dance is open perspective, film dance has the opportunity to be forced perspective; it also provides the opportunity to explore and perform in spaces that can’t be replicated for the stage (the top of a skyscraper, a large warehouse, a canyon, etc.) This is very similar to the relationship between theatre and film/television. Dance for the camera takes the same concepts that film and television benefit from as opposed to stage performances, even considering the disadvantages of filmed dance. Film dance opens windows for entirely different structures of dance, and even to develop a new process of creating movement. Suddenly with cutscenes, movement no longer has to be linear and transitional. The movement can be edited, distorted, have images, words and sounds added to it. Winghart’s choreography in A Thousand Faces has the capability of seeing dance from a birds-eye-view, and even intense close-ups, something not easily available for the stage. Technology makes new structures of art possible, and I don’t believe it has been realized fully in every other art form. Not yet, at least.
The future of art will embrace technology. It will explore it’s advantages and disadvantages. It will become more than just the embellishments to a piece, it will become it’s own form of art entirely. Artists of all kinds: dancers, singers, painters, sculptors, directors, choreographers, cinematographers, musicians, costumers, poets, and more, will add their own ideas, their personal arts concepts and techniques to develop new art forms. Ones that will push their own art forms and create interesting subcategories, or even create ones we’ve never thought of before. The possibilities are endless once artists consider technology as new medium for creation.
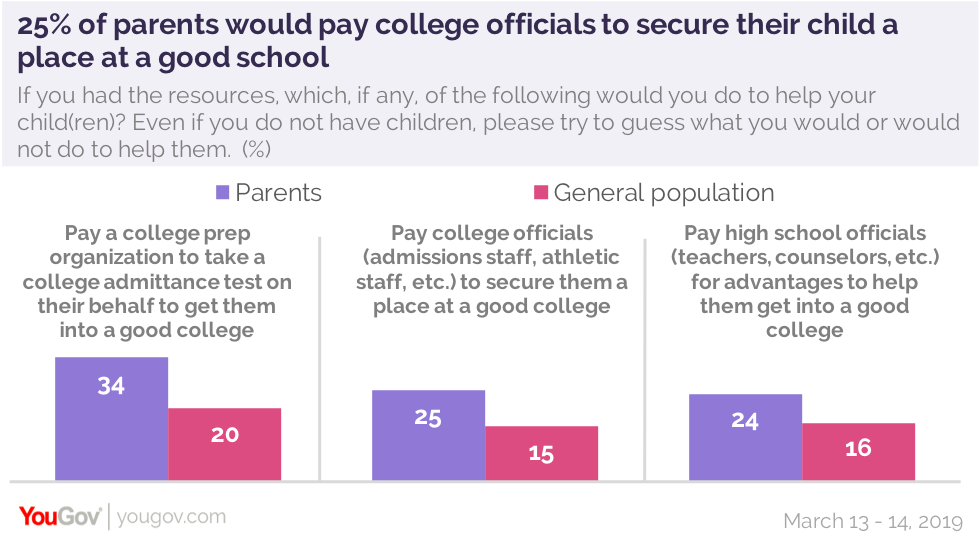
This month, several celebrities have been caught taking part in a bribery scandal to get their children into highly selective institutions such as University of California schools, Stanford University, and the University of Southern California (Yan, 2019). While the link between wealth and access to education is not new, this outright corruption is somewhat surprising. Recently, YouGov administered a poll to over a thousand individuals to assess how many quotidian (rather than celebrity) parents would also engage in this bribery for their own children. An article about the survey concludes that “25% of parents would pay college officials to secure their child a place at a good school” (Ballard, 2019). However, due to bias in the survey’s data collection, the premise of YouGov, and the context of when respondents were answering, the article is likely over-reporting how many parents would actually engage in this bribery.
As one of my classmates explained in a presentation, the reliability of YouGov’s data is questionable. YouGov is a service that allows individuals to participate in surveys similar to this one for a financial incentive. Presumably, members of the service merely want to get through as many surveys as possible to maximize their earnings. It is possible that some respondents answered a hasty and impulsive “probably would” or “definitely would” to the question without genuinely reflecting on the ramifications of this hypothetical bribery.
To make up for the inherent pitfalls of survey-based data collection, YouGov weights the responding sample “to the profile of the sample definition to provide a representative reporting sample. The profile is normally derived from census data or, if not available from the census, from industry accepted data” (YouGov, 2019, p. 2). Considering the varying proportions of individuals who answered “probably would” or “definitely would” to the question of interest across demographics, I am unsure if adjusting the weights of samples maintains the data’s integrity, especially with the skew already involved in an online survey.
Lastly, the timing of the survey’s administration may have affected individuals’ responses. Many parents of soon-to-be college-aged youth may feel disenfranchised with the education system following the recent coverage of this scandal (for what it’s worth, 64% of parents and 67% of the overall respondents in this survey agreed that “[t]he education system in the US is rigged in favor of wealthy students” (YouGov, 2019, p. 9)). This frustration may have inflated the amount of people who responded that they would pay their child’s way into a good college. This speculation aligns with the data, showing that respondents who make under $30k per year were more likely than those who make over $100k annually to answer that they would bribe a college official on behalf of their child.
Given the premise of YouGov as a means of data collection and its methodology, the finding that “25% of parents would pay college officials to secure their child a place at a good school” (Ballard, 2019) seems to provide more shock value than meaningful information about the prevalence of bribery in the world of higher education. It would be worth investigating if a less biased survey without the adjusted demographic weights and sufficiently after the wake of the scandal would yield similar results.
Over the past decade gun violence has amplified in frequency, press coverage, and egregious outcomes in the United States. The news has been filled with stories about mass shootings- Sandy Hook, Aurora, Orlando, Sutherland Spring, Las Vegas, Parkland, Thousand Oaks, Squirrel Hill, and many more. There are even more stories about gun-related suicide deaths, gun-related homicide with in the home, and gun-related injuries. Still it can be difficult to disentangle the misinformation and lack of understand that surrounds the gun violence epidemic. One reason this issue exists is because of the difficulty the United States Government, specifically the Center for Disease Control and Prevention, has had gathering data on gun violence. In this blog post I will look at the CDC in an attempt to understand ways we can improve our understanding of the gun violence epidemic.
The Center for Disease Control and Prevention is a federal agency that researches the health, preparation, and prevention in the United States to create national strategies to improve public wellbeing. Many people think about the CDC in terms of the diseases and conditions it studies, but the CDC also conducts research on motor vehicle injuries, prescription drug overdoses, child abuse, sexual violence, and more. Unfortunately, for years the CDC was unable to advocate for gun control as a result of the Dicky Amendment. This amendment was created in response to a study published in the New England Journal of Medicine that concluded gun ownership was a risk factor for homicide in the home. The amendment allowed the CDC to study gun violence, but took a away the vast majority of funding for that research. Although many of these restriction were removed from the CDC in 2018, I believe that the Dickey Amendment was and continues to be a significant contributing factor to the misinformation and lack of understanding that surrounds gun violence.
What’s worse still is that the information the CDC can provide about the gun violence may be fundamentally flawed. First, the CDC is only recording the number of gun-related injuries and deaths in 40 states, the District of Columbia, and Puerto Rico in their NVDRS database, which means that a little over 19% of the country is unaccounted for. It’s difficult to gain a pervasive understanding of gun-related injuries and deaths in the United States when 19% of the data that should be gathered is missing.
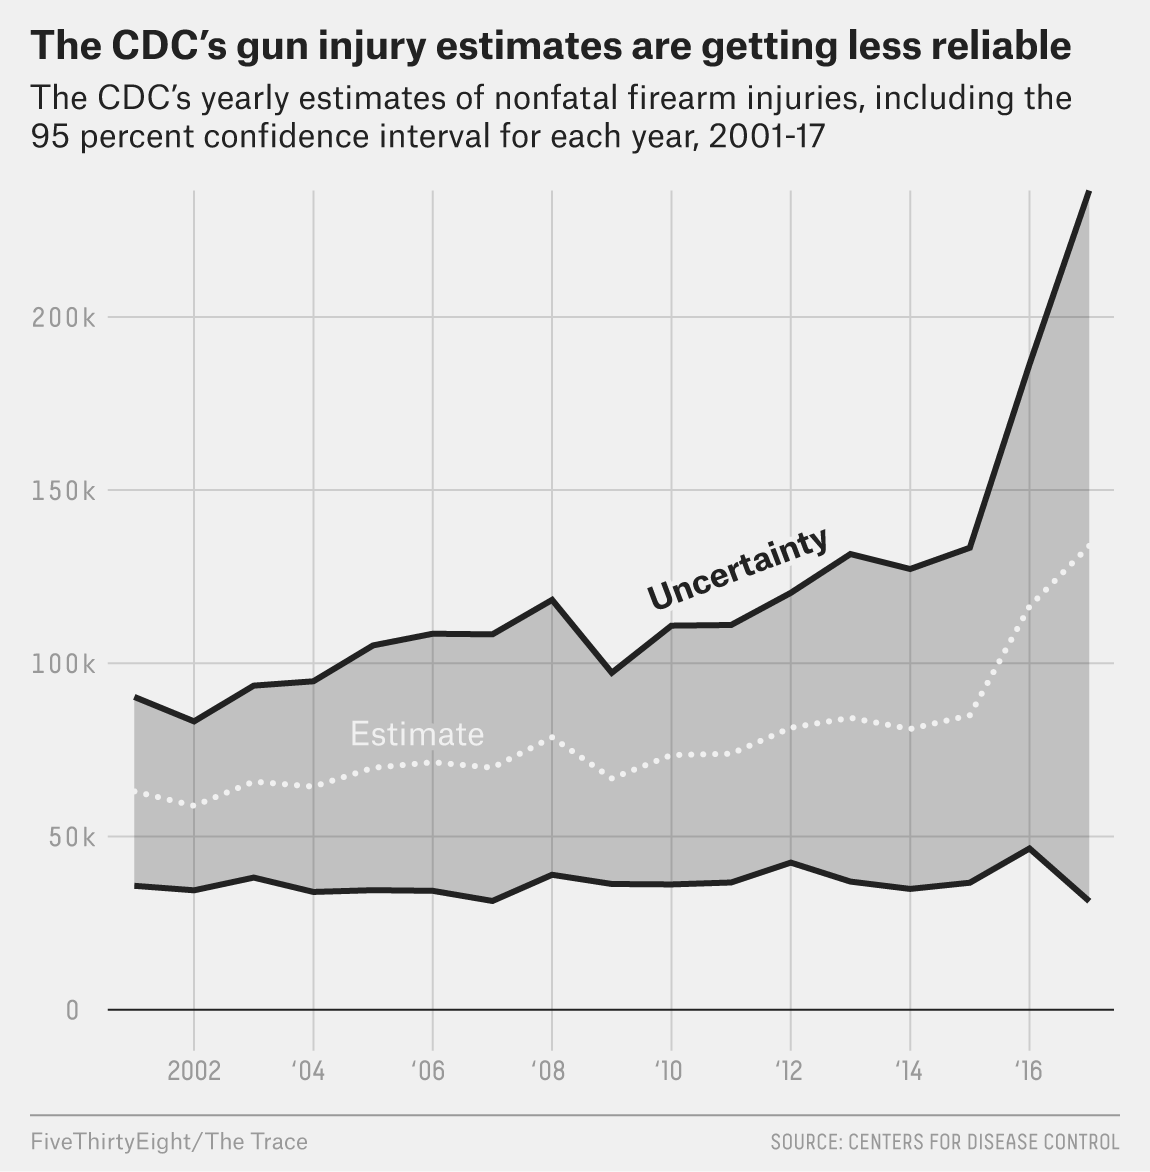
As a result of increasing funding restrictions, the CDC had been decreasing their sampling pool. In 2017 the CDC only gathered data from 66 hospitals according to a meta-analysis conducted by FiveThirtyEight and the Trace. A sampling pool that small has the potential to drastically skew a dataset. What if one hospital treats more gun wounds than is standard? Or less? How are we supposed to determine a standard for the country based off of 60 hospitals? This is reflected in the data reported from 2017. That year the CDC reported that somewhere between 31,000 and 236,000 people were injured by guns, which is four times wider then what they reported in 2001.
The graph above highlights the level of uncertainty from the coefficient of variation (a measurement of the standard error) from 2001 to 2017. The coefficient variable rose from 22.1 percent to 39.1 percent over that time. According to the CDC a national estimate should be considered unstable and potentially unreliable if the coefficient variable exceeds 30 percent, so 39.1 seems to reflect the precariousness and failing of the CDC’s sampling.
The impact of this unreliable reporting from the CDC is far-reaching. The data collected by the CDC is used by researchers, journalists, reporters, professors, and lawmakers. There is a lot of opportunity for that data to be warped before it reaches the general public. As a country we need to obtain a better understanding of the gun violence epidemic we face, and we can not do that without reliable data to guide our political actions.
In the United States today, more and more people are becoming obese and are at high risk for heart disease and other illnesses. A lot of the media has even claimed obesity to be an epidemic. Food companies such as Coca Cola perpetuate problems relating to obesity and heart disease. Their distracting pseudo agenda promotes helping Americans consume less overall caloriesand live healthier lives by providing research money in studies, when in fact, their underlying objective is their quest to make a profit. In 2015 Coca Cola created a nonprofit called the Global Energy Balance and funded research surrounding obesity. Research created by Coca Cola and other large companies for their own agenda are deeply detrimental to American people’s lives because research that is posed as unbiased leads Americans into believing that their products are a healthy choice. This topic is interesting to me because as a consumer, I am constantly seeing studies enacted that suggest what to eat, what is healthy, and what is not. So how do companies like Coca Cola exacerbate problems such as obesity in the United States?
As new evidence plasters headlines indicating a link between sugary drinks and obesity linked diseases, the companies must fight back. Companies such as Coca Cola invest their money into creating low-calorie, zero sugar, “better for you” soft drinks. Zero sugar soft drinks still include artificial sweeteners so the product will retain the same flavor without the calories and negative impacts of traditional sweeteners. In a study done by the USDA economic research service, sugar intake is decreasing but artificial sweetener consumption steadily increases. The study concluded there is a positive correlation between the rise in obesity and usage of artificial sweeteners.
Figure 1: This graph shows the correlation between sugar intake daily, the percent of people using artificial sweeteners and the percentage of adults with obesity from 1980-2013. This correlation was further validated by The Growing Up Today Study done by the University of Texas Health and Science Center involving almost 12,000 adolescent boys showed long term weight gain with diet soda.
Not only do companies such as Coca Cola say they create better products that will not negatively affect a person’s health, but they pay researchers to say the same. Coca Cola supports the idea of living a healthy and active life, and that calorie counting is not as important. An article from the New York Times described new research that conveyed the following: “Last week, the Pennington Biomedical Research Center in Louisiana announced the findings of a large new study on exercise in children that determined that lack of physical activity ”is the biggest predictor of childhood obesity around the world.” The news release contained a disclosure: ”This research was funded by The Coca Cola Company.” This example is certainly not an individual case. Consumers are being fed supply information with evidence from research studies, that big companies have funded. Food giants much like Coca Cola are shaping consumers minds about what choices in the supermarket are healthy.People rely on the common idea that companies value the public’s health. Whereas the harsh reality is that these companies’ bottom line is earning a profit. For example, if Coca Cola stated that Coke is actually harmful, it would negatively affect their profit. It is much more cost effective to add “zero sugar” on a label even though it does not improve the nutrition of that product. Nevertheless, there continues to be a rise in obesity rates and chronic disease relating to obesity rates in the United States.
It is not a coincidence that food corporations are gaining profit and obesity rates are still inclining. Money is the underlying theme in the bridge between what consumers hear is good for them, and what these companies want them to hear. Food corporations are not concerned with the “obesity epidemic.” The data concludes that large companies have more of a priority in continuing to sell product, rather than reducing the risk of chronic disease in consumers.