Why do people question the science of climate change?

In the United States today, there is a powerful debate about the existence of climate change, specifically regarding human-driven global warming. Although most climate scientists claim that there is strong evidence to suggest that the current warming of Earth’s climate is driven by anthropogenic influences, many people in the U.S. still have doubts about whether human action is leading to increased temperatures. With such strong scientific evidence backing up this global phenomenon, what is causing people to question its existence?

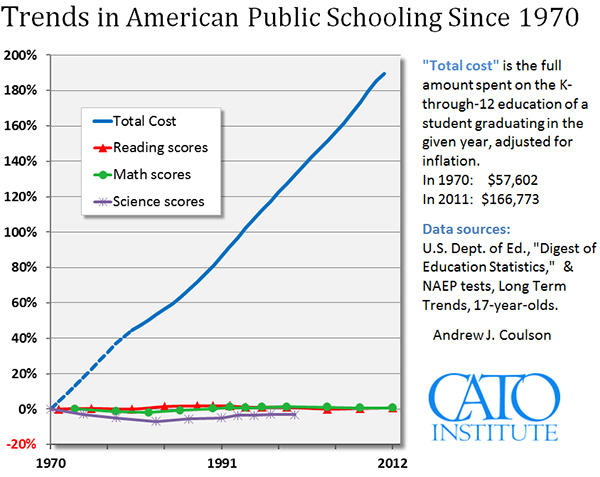
One common answer to this question is that people are simply ignorant about the science proving global warming. One study, conducted at George Washington University Law School by Donald Braman, Dan M. Kahan, Ellen Peters, Maggie Wittlin, Paul Slovic, Lisa Larrimore Oullette, and Gregory N. Mandel, claims that the divisions in beliefs about the existence of global warming stem not from a lack of scientific knowledge, but from people’s desire to interpret the science they read in a way that aligns with the popular ideas in groups that they associate with. The scientists argue that with as scientific literacy increases, people are actually less likely to believe in the risks that accompany a warming climate. Their findings are shown in Figure I, below.

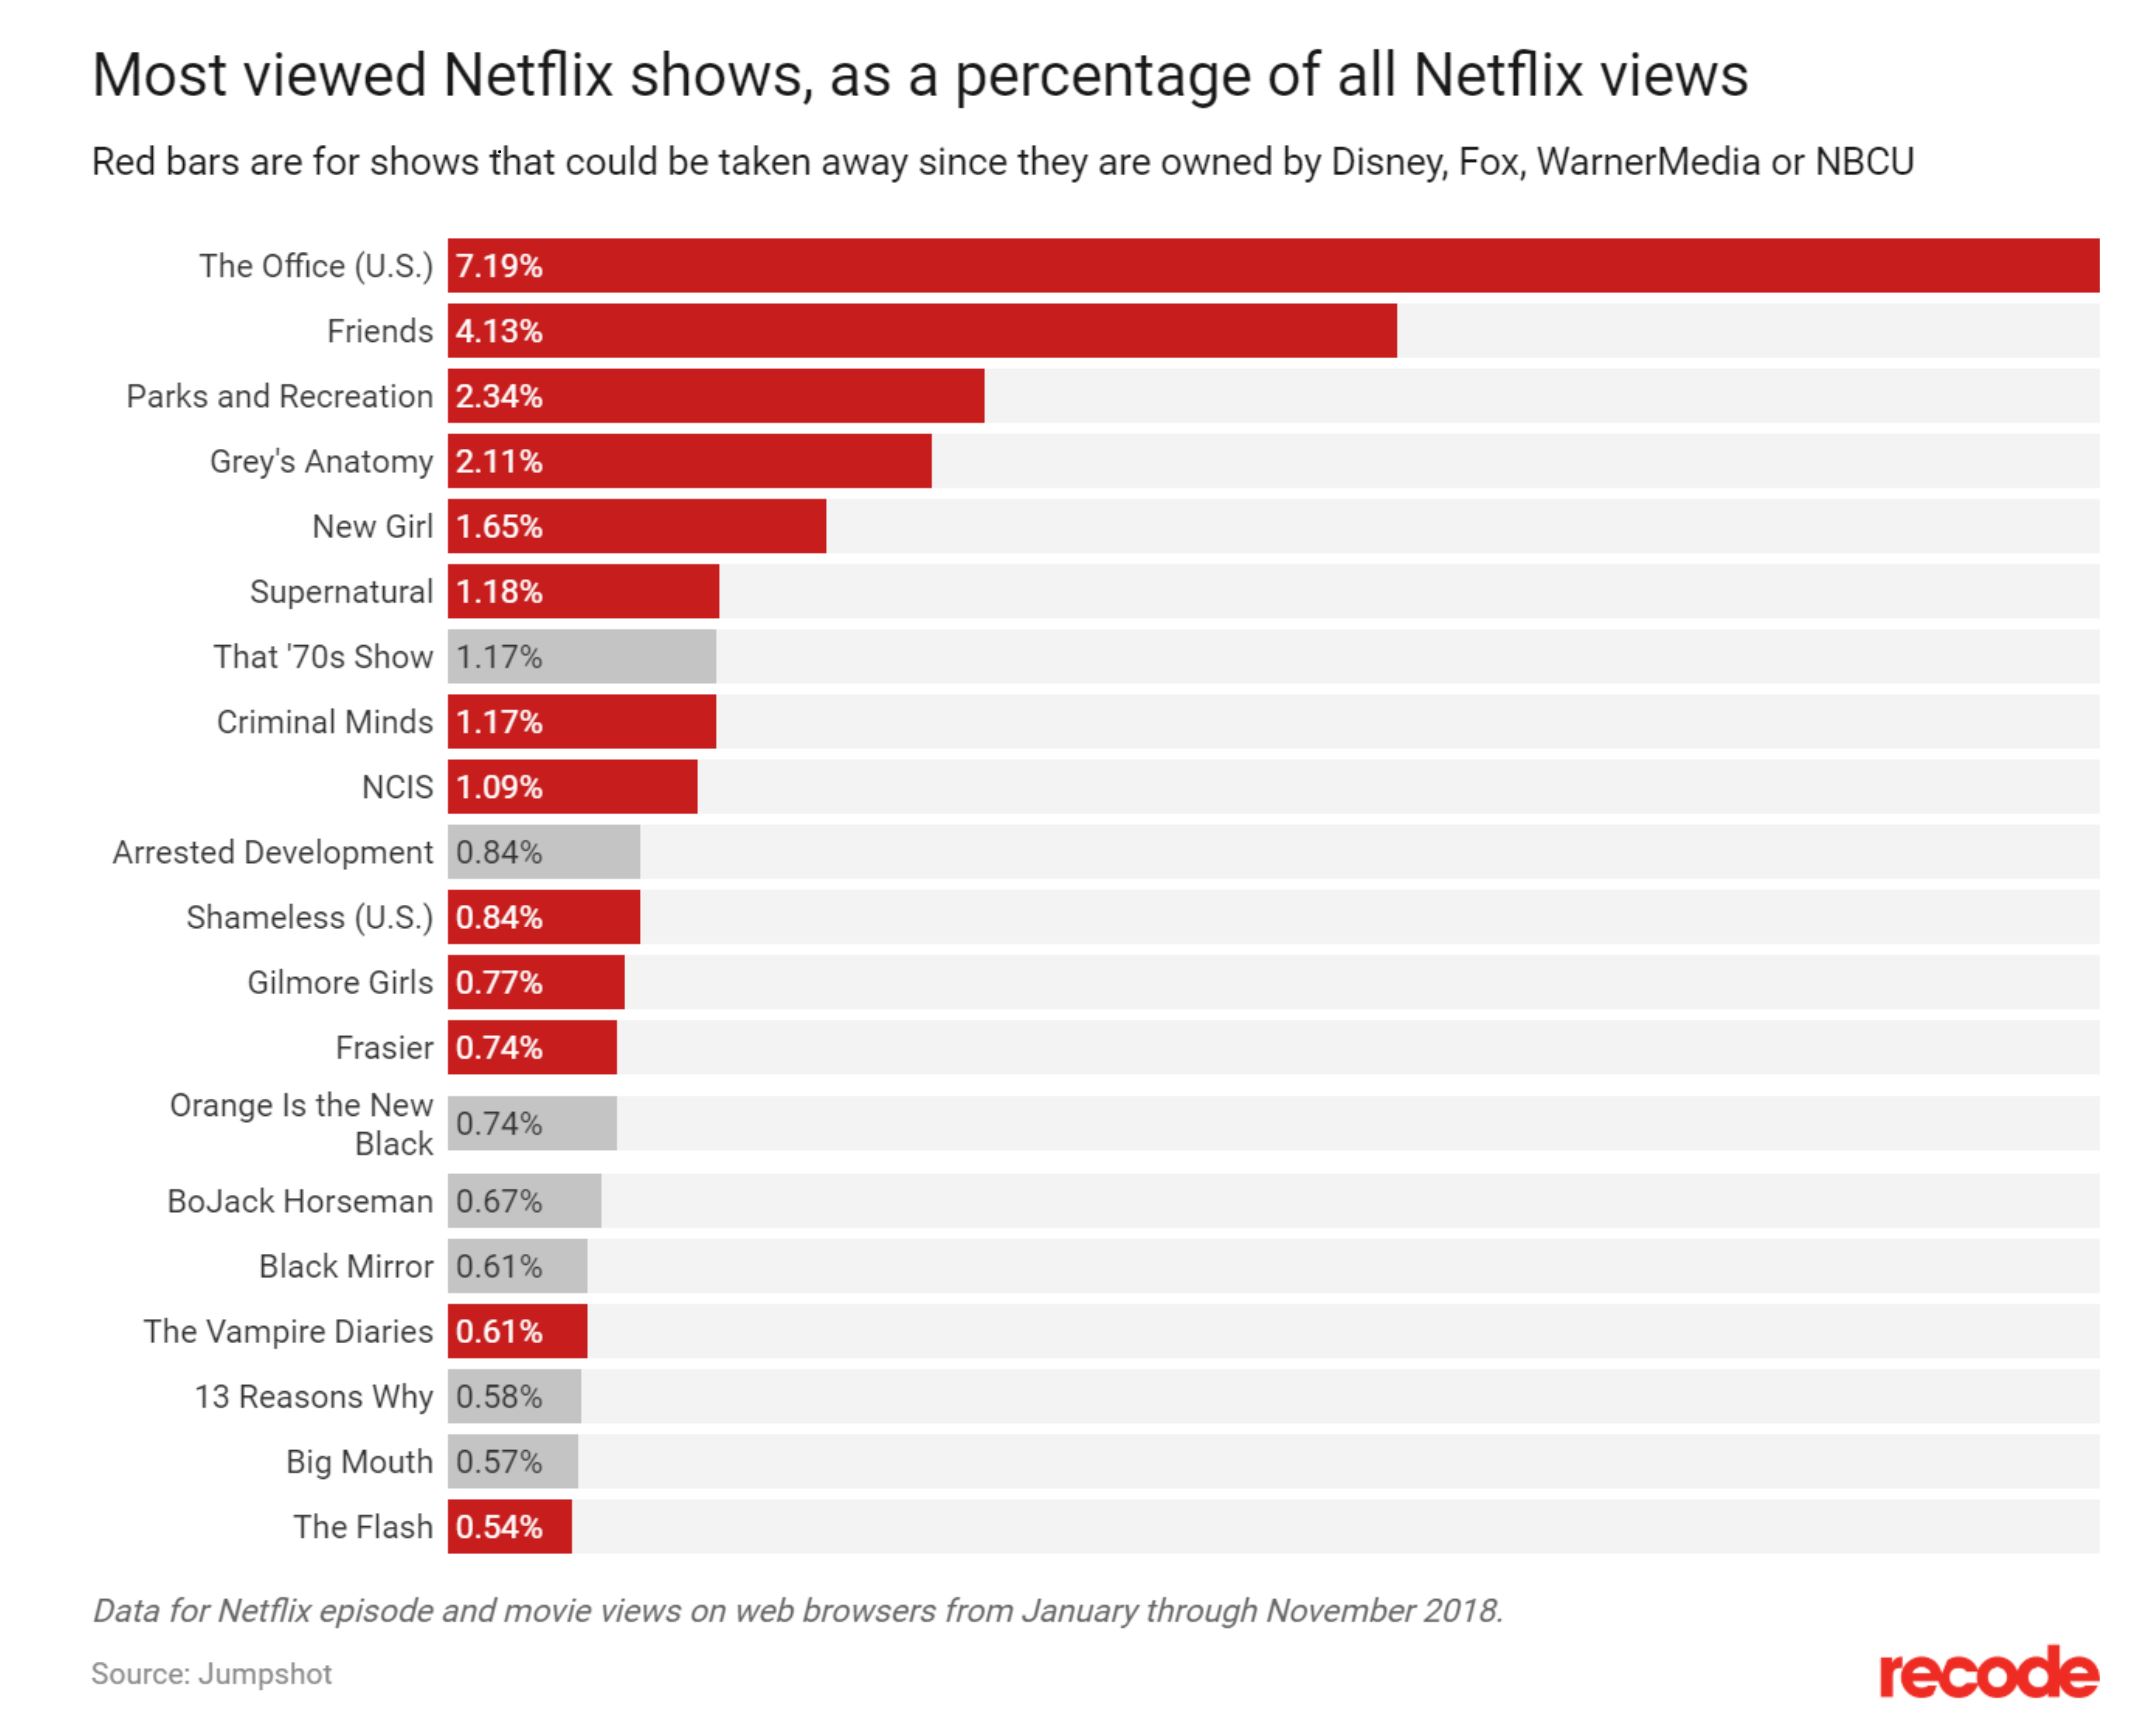
Figure I: The first graph demonstrates what the results of the question “how much risk do you believe climate change poses to human health, safety or prosperity?” would be if science literacy and perceived risk were correlated. The second graph demonstrates the actual relationship between science literacy and perceived risk according to the study, with z-scores of perceived risk on the x-axis.

The study had a large sample of 1,540 participants. The authors of the study claim that the study was representative, and the large sample size is one indicator of a representative sample. However, the individuals included in the sample were members of an online testing group called Knowledge Networks. This group has a selection pool of 50,000 adults who are recruited to participate in various research. Voluntary online surveys can be problematic because they introduce non-response bias into the scientific conclusions of studies. Because some people may not respond to surveys that they are asked to participate in, the sample may not truly be representative of the entire U.S. population. The people that are willing to respond to a survey about global warming may be more passionate about the existence (or lack thereof) of the climate crisis, and may skew the results of the study.

Participants of the study were first asked about how big of a risk global warming poses to human health, safety or prosperity (on a scale of 1-10). They were then tested for scientific literacy, which is another questionable aspect of this study. Participant’s scientific literacy was determined by their answers to eight true-or-false questions, including “lasers work by focusing sound waves” and “antibiotics kill viruses as well as bacteria.” Although these questions may do a satisfactory job at testing participant’s general knowledge of science, they are not an accurate predictor of people’s knowledge of the science of global warming. Because human-driven climate change is a hugely politicized and popular issue, the science about climate change is much more accessible and talked-about than science about lasers or antibiotics; published science about climate change is consistently at the top of the lists on popular news sources. Because the science is frequently discussed, people likely have a much higher exposure to academic science about global warming than other areas of science. People’s knowledge of random scientific facts about lasers and antibiotics is not an accurate predictor of their knowledge about global warming.

Overall, the scientists at George Washington University Law School use their findings to argue that more published studies proving the existence of climate change are not the answer to solving the climate crisis. They claim that, in order to convince the general public that action needs to be taken to prevent further warming, literature published about climate change needs to be less focused on precise scientific findings and more focused on communicating the science in a way that doesn’t threaten the values of diverse groups. Although it is never a bad idea to broaden the audience of climate change discussions, scientists must be careful to avoid framing their findings in a way that represents a skewed version of the truth simply to accommodate the biases of broad social groups. This is especially true if the findings of the this study (that scientific literacy and perceived risk of climate change are not positively correlated) are not accurate.

Referenced:Braman, Donald, et al. “The Polarizing Impact of Science Literacy and Numeracy on Perceived Climate Change Risks.” GW Law Faculty Publications & Other Works, GW Law, 2012, scholarship.law.gwu.edu/cgi/viewcontent.cgi?article=1298&context=faculty_publications

Data and the U.S. Census 

Robert Kennedy once said, “The glory of justice and the majesty of law are created not just by the Constitution – nor by the courts – nor by the officers of the law – nor by the lawyers – but by the men and women who constitute our society”. But how do we determine the people who make up our society? Article I, Section 2 of the Constitution mandates that every ten years the population of the United States should be counted. The United States Census Bureau gathers data directly and indirectly to determine the make-up of the population. It’s a ton of data. The next Census will happen in 2020 and it will require the Census Bureau to count more than 330 million people. After that data is collected it will be used to determine district lines, the number of seats in the House of Representatives, and billions of dollars worth of federal funding. It’s a big job, and it has some major consequences. This blog post will explore the methodology used in gathering data for the U.S. Census, and asses some of the potential room for error. 

This video was created by the U.S. Census Bureau to describe the process the Census Bureau intends to take in 2020. The major change from previous Censuses is the department’s intended use of “Administrative Data” and data collected from other agencies, state governments, local governments, and some commercial sources. According to the video the Census Bureau will cross-analyze this data to predetermine what houses are vacant in an attempt to save time and money. Merging data from third party sources can be a powerful asset, but it has the potential to create serious issues. The source data may be incomplete, inaccurate, or misleading without any logical way to deduce what the Bureau may have or what they are missing. This potential issue is amplified by the fact that the 2020 Census is seriously underfunded. The new technology may save money in the future, but right now the technology being used to collect and compare source data isn’t being properly tested as a result of underfunding. 

Another way the Census Bureau is attempting to save money and increase response rates is by having respondents answer survey questions online. In 2016 the Census Bureau released the 2020 Census Operational Plan which states a goal of 55% of the U.S. population will be responding through the internet. The Government Accountability Office raised concerns about fraudulent responses. Unfortunately, two of the three tests that were planned to evaluate the effectiveness and validity of the new system were canceled due to budget concerns. In an effort to protect citizens against fraudulent response rates the Bureau intends to send citizens an access code to the survey through the mail. The major problem I see with this is that is concedes one of the greatest benefits of an online survey- not everyone has a physical mailbox. 

Vulnerable populations like minorities, people who don’t speak english, people who experienced abuse, and people who are experiencing homelessness don’t always have a mailbox to be contacted through. As a result, they have often been overlooked by the Census Bureau time and again. Congress and the Supreme Court have made it illegal for the Census Bureau to use data sampling for the Census, and the current plan proposed for the Census doesn’t account for this oversight. In fact, the 2020 Censes will have 200,000 fewer Census workers on the ground, which has the possibility to heighten that oversight. 

In many ways the Census serves as a backbone for the American system. It is a vast and complicated process, and any error can result in serious issues for the effectiveness of our government. Right now, I am worried about the room for error that exists in the plan for the 2020 Census. It is critical that the Census Bureau has the funding and tools it needs to increase the validity of their work. 

Sources: 

Kennedy, John. “Address by Attorney General Robert F. Kennedy at the Law Day Ceremonies of the Virginia State BAr.” The United States Department of Justice, 1 May. 1962, https://www.justice.gov/sites/default/files/ag/legacy/2011/01/20/05-01-1962.pdf 

US Census Bureau. “About the 2020 Census.” Census Bureau QuickFacts, United States Census Bureau, 30 Aug. 2018, www.census.gov/programs-surveys/decennial-census/2020-census/about.html.

Uscensusbureau. “2020 Census Innovations: Streamlining the Count Using Administrative Data.” YouTube, Uscensusbureau, 27 Jan. 2017, www.youtube.com/watch?time_continue=106&v=g4_r1LggI7Y.

US Census Bureau. “About the 2020 Census.” Census Bureau QuickFacts, United States Census Bureau, 30 Aug. 2018, www.census.gov/programs-surveys/decennial-census/2020-census/about.html.

Chang, Alvin. “How Republicans Are Undermining the 2020 Census, Explained with a Cartoon.” Vox.com, Vox Media, 30 Aug. 2018, www.vox.com/2018/5/7/17286692/census-republicans-funding-undercount-data-chart.

Does school choice save students from a “lagging” public education system?

In recent decades, the American public education system has seen a rise in demands for school choice and privatization. These movements work within a larger shift towards neoliberalism in education. Major proponents of school choice capitalize on parents’ desire to send their children to the seemingly best school; to sell their own schools, they antagonize the public education system in an effort to convince parents to support legislation that would allow the transference of tax dollars from public schools to these stakeholders. In their introductory article on school choice, the Cato Institute’s Center for Educational Freedom supports this movement and (irresponsibly) uses data on federal education spending and test scores to paint a misleading picture of the American public education system.

The article displays the above graph to portray federal education spending as wasteful and ineffective. However, the authors fail to consider the plethora of resources that public schools are now expected to provide. Since 1980, districts have increased spending on Title I schools (those with large low-income populations), technology, English language acquisition programs, special education, career and technical education, and assessments (U.S. Department of Education, 2018). These changes and increases in spending reflect a changing social context and student population. For example, in the past almost fifty years, the country’s percentage of people who speak English as a second language has grown (Ravitch, 2014). Considering schools’ growing role as an institution of language acquisition, it is remarkable (and attributable to increased funding) that they have achieved approximately the same scores on the long-term NAEP exam.

Additionally, it is unfounded for the authors to assess schools’ effectiveness or quality on test scores, and this graph in particular misconstrues their meaning. By demonstrating the 90% increase in total cost, the Cato Institute implies that a 90% increase in test scores would be satisfactory. This is unreasonable considering that the average seventeen-year-old’s long-term NAEP score in 1970 was 285 out of 500 — if the score were to match the budget’s increase, it would rise to 541. Not only is this higher than what is possible on the exam, but a perfect score on the exam is itself ridiculous because the long-term NAEP test scores on a scale of accuracy, not proficiency. A perfect score on the long-term NAEP exam does not indicate being at “grade level” or subject proficiency.

The Cato Institute portrays assessment data as reflective of the education system’s quality and links school funding to the expectation of increased “success” on these exams. However, this view of the public education system lacks nuance and regard for the growing role that schools play in youth’s lives. Instead, depending on assessment data for a depiction of schools’ effectiveness disregards the resources that these institutions provide.

References

Cato Institute. Educational freedom: An introduction. Retrieved from https://www.cato.org/education-wiki/educational-freedom-an-introduction

National Center for Education Statistics (2013). The Nation’s Report Card: Trends in academic progress 2012 (NCES 2013-456). National Center for Education Statistics, Institute of Education Sciences, U.S. Department of Education, Washington, D.C. See Digest of Education Statistics 2013, table 221.85. Retrieved from https://nces.ed.gov/programs/coe/pdf/coe_cnj.pdf

Ravitch, D. (2014). Reign of error: The hoax of the privatization movement and the danger to America’s public schools. New York, NY: Vintage Books. 

U.S. Department of Education. (2018). Education department budget history table (1980 – 2019). Retrieved from https://www2.ed.gov/about/overview/budget/history/edhistory.pdf

Do dollars translate to quality of life

How is wealth to be measured?

On gapminder.org, I looked at the first article on their homepage called “Welcome to Dollar Street — where country stereotypes fall apart” The article consists of images of individuals/families with the amount of monthly income they make in USD, and the country they reside in. Contradictory to its claim, the photo article perpetuates the stereotypes that we already have of the living conditions of people in different parts of the world.

In the article, the incomes range from $25 to $10,800, and are labelled “poorest” and “richest” respectively. In the United States, an income of $10,000 a month for a family of 9 (as shown in the photograph) will probably not even make it to the middles class status.

You also get to pick from different parts of the world including: Africa, Asia, Europe and the Americas. Moreover, you can choose your own income range or compare between multiple continents/countries. However, they have a lot more data from Africa and Asia than anywhere else.

What are the problems with this approach of measuring wealth?

First, the USD is not the same everywhere. The same amount of money might have different buying powers in different countries. This phenomenon is not difficult to observe at all. Say, you work at an IT firm in San Francisco making $64,000 a year and your firm allows you to work up to 3 months a year from home. So, you decide to live close to your family in Idaho for 3 months each year, paying 2/5 of the rent you would be paying in San Francisco. You still earn the same amount, but you can do a lot more with your money now. You can eat out more, take more uber rides, party every weekend, and still have leftover money you can save for your parents’ retirement! No only that, you can afford more unpaid off-days.

Moreover, the article claims that, “The everyday life looks surprisingly similar for people on the same income level across cultures and continents.” Does it now? For the first 6 months in the United Stated, I would be devastated by how expensive everything was every time I went shopping. Numerically, it is true that $1 = NRP 106 (Nepalese rupees) give or take. However, I have grown to learn that they don’t mean the same thing. I come from a fairly privileged middle-class background. Interestingly however, if I were to quit school and work 50 hours for minimum wage in Denver, I could make my family’s yearly income in about 3 months. Standard of living and quality of life depends predominantly on your income’s value or buying power in the place it is being spent, and the amount of desires it is capable of fulfilling. Living in Denver, however, if I got an average, convenient place, I would probably spend close to 3/4 of my income on rent and utilities alone, and hence, I would have a much poorer quality of life than my parents at home. In this sense, a $2 daily wage somewhere in Asia may be equivalent to an $8 per hour in the United States.

How does this data affect the way we view the world?

Disclaimer: The data in the article is not the whole problem, but it exists within a global framework of social hierarchy.

A lot of big words, let’s break it down! We live in a post-colonial world where Western European countries and the US are considered the standard against which all other countries/continents are to be measured. The former are seen as the most ideal, developed, civilized societies ahead of everyone else. Many tools have be developed to quantify this view of the world and the international monetary exchange rate is one of the more efficient ones.

While I admit that the demographic and numerical data on the website must be accurate, not all interpretations of such data show the true picture. We can look at the numbers on the website, but numbers don’t speak for themselves, and nor can the people in the photographs.

How does this view of the world affect consumer spending behavior?

Whether or not we still use the terms “first world” and “third world”, the ideas have survived. When the “third world” is shown to the “first world”, the narrative is always of a less civilized place torn with poverty, famine, war, illnesses, bankruptcy and more. They are shown as being less than and needing help from the Western world. The gapminder.org’s article paints a similar picture of Asian and African countries. The numbers fail to portray an accurate picture of the kind of lives these people have in relation to the economy of the place they reside in.

These one-sided stories told in the Western parts of the world of Asia and Africa lead to post-colonial white guilt. They become tools of a capitalist economy to commercialize charity and donations to Asian and African countries, a lot of which end up misallocating valuable resources and funding unsustainable development projects. At the end of the day, when the numbers given in the data are not put into perspective, anyone in these countries can appear to be needing financial support.

Are there other ways of measuring quality of life?

Since bigger numbers don’t always translate to better quality of life, let us look at other things we might consider to measure the same. For instance, is a person to be considered wealthy if they have more dollars than another, if they lead a really hectic life and has no time for themselves? In a lot of countries in Asia and Africa, the middle class make significantly less in dollars than the American middle class. However, their jobs are less stressful and more satisfying, they have more personal time and paid off-days, and significantly lesser unfulfilled desires. Should these not be considered when measuring a person’s quality of life?

I think quality of life depends on a lot of things like social equity, how secure you feel in the area that you live, whether you believe the government works in your good interest, and whether you are satisfied or if your economy makes you feel like you constantly need more. None of these can be depicted using USD figures, and so, the article fails horribly at portraying the real lives of the people in their photographs.

The Eggs. They’re Full of Cholesterol.

The website Funny or Die produced a video in which a dietician time travels to 1979 and interrupts a couple’s morning, heralding modern science and the health implication of their breakfast.   He returns every couple seconds as time and science progress, each instance with new recommendations.  Although meant as comic relief, the video addresses the problem of where people get their health information while being bombarded by changing health recommendations.  It brings up the question: Is it ethical to present health data to the public without an adequate trial period?


According to the Pew Research Center, 72% of Americans believe that healthy eating is important to living a long and healthy life (pewresearch.org). Diet culture and health trends that play off this belief make up an entire billion-dollar industry. How to go about healthy eating is where the chaos begins.  Because people want to live long and healthy lives, there is a huge monetary incentive in telling people what is good for them.   As a result, information about foods to cut and macronutrient ratios comes from every direction; 72% of Americans say that they frequently hear news about the health effects of certain foods that contradict other previous news that they have heard (pewresearch.org).

screen shot 2019-01-20 at 9.59.24 pm

Because of the direct health implications of the foods that a human consumes, it is in many ways a medication.  Food choices have been shown to be preventative to a variety of diseases, including: cardiovascular disease, diabetes, certain types of cancers, as well as others (McCarty, 1999).  However, food recommendations do not go through a stringent clinical trial process like other medical remedies.  In the scientific process, someone does research, tests their hypothesis, then their conclusions hold true until someone else disproves them.  Disproving previous results is how science progresses; it is part of the process.  However, health culture is one of the only industries in which the results are both widely available and have such an immediate public health effect.  Conclusions are presented directly to consumers, and they are often already implemented when new science rebukes the previous conclusions.   Theories are rapidly updated and changed at the expense of the consumer.

Most people understand the basic tenets of eating healthy, even if they do not always follow them: eating in moderation, consuming fruits and vegetables, and drinking enough water.  However, food science as a verifiable option for preventative medicine (and in some cases a treatment) should not be discounted.  Because of the constantly changing data, 37% of Americans say that “the research about the health effects of what people eat and drink cannot really be trusted because so many studies conflict with each other” (pewresearch.org).  If this field is going to continue to develop, a trial system needs to be established to ensure quality of data that is being presented to the public.

References

Armstrong, C. Stockman, C. [FunnyOrDie]. (2017, July 27). This Is Why Eating Healthy Is Hard (Time Travel Dietician)[Video File]. Retrieved from https://www.youtube.com/watch?v=5Ua-WVg1SsA

Mccarty, M. F. (1999). Vegan Proteins May Reduce Risk of Cancer, Obesity, and Cardiovascular Disease by Promoting Increased Glucagon Activity. Medical Hypotheses, 53(6), 459-485. doi:10.1054/mehy.1999.0784

Public Views About Americans’ Eating Habits. (2016, December 01). Retrieved January 20, 2019, from http://www.pewresearch.org/science/2016/12/01/public-views-about-americans-eating-habits/

You Won’t Believe What This Post is About!

Despite the apparent lack of information pertaining to the content of this post, the title actually does describe what I want to talk about. The internet is plagued with titled links congruent to mine. What I want to explore is whether or not clickbait such as these are successful strategies in promoting content, and if so, which bait catches the most fish? I want to know what factors decide how likely I am to click on something, and what decisions are made in society to profit off of that information.

Clickbait is an extreme consequence of effective headlining. For a normal article, the title needs to be concise and enticing. You need to communicate the promise of your piece, and inform potential readers what they could be in for. Clickbait follows the same guidelines for titles, but the actual content is often more vacuous and less interesting than it was previously made out to be. Clickbait that fails to deliver in content is by far the most unsatisfying, however studies and market values agree that when used effectively, it can be an excellent way to promote and viralize your content. For the purposes of this discussion, the term ‘clickbait’ will refer to articles with titles designed specifically to maximize the amount of visitors to the content, and to see if this is a successful strategy in marketing said content.

Clickbait titles often employ strategies like mystery, shock factor, and emotional appeal to goad you into clicking. “Find out more”, “You won’t believe”, “Which _____ are you most like”, “The shocking truth behind ____” are all common formulas to get you curious about what’s packaged underneath the title. The chart below shows common attributes of online titles that have been identified as ‘clickbait’. Most of these categories fit in the lines of something that either picks at your curiosity, or something that is designed to feel personable.

Clickbait has success stories as well as horrible failure stories. Perhaps the most famous media outlet focused around the idea is BuzzFeed, which has a remarkably high success rate from articles titles in a clickbait fashion. In fact they use it so successfully that they were even able to write a clickbait article about buzzfeed clickbait articles.

That article is focused around the following chart (sort of), which shows BuzzFeeds most successful clickbaiting phrases. The chart highlights appeals that are most likely to cause clicks. The first and third top phrases, for example, both appeal heavily to emotion; the first likening a reader to a character (probably one they like) and the next expressing the urgency of mortality. If someone tells you to do something before you die, chances are you might be inclined to listen, and it is that emotional appeal that this phrase employs.

While BuzzFeed is able to employ this marketing tactic to their advantage, many experts warn against clickbaiting for any outlet focused on producing more serious content. In his Time article entitled “What You Think You Know About the Web Is Wrong” CEO of Chartbeat Tony Haile describes the issue, ” chartbeat looked at deep user behavior across 2 billion visits across the web over the course of a month and found that most people who click don’t read. In fact, a stunning 55% spent fewer than 15 seconds actively on a page.” 15 seconds is definitely not enough time to get a serious point across, however it is roughly enough time to get a solid grasp on the Buzzfeed meta-Buzzfeed article talked about previously in this post. It comes down to what audience you are targeting, or if visitation numbers is more important to your business model than content propagation. According to Haile, capturing attention for shorter periods of time makes your users much less likely to return. So a 15 second use time is incredibly unlikely to result in a returning user, while a 3 minute one is much more likely to do so. I would argue that this reason is why sites like BuzzFeed use nested clickbaits; where the entire article contains links to more and more clickbait articles “you might enjoy”. If they can grab your attention for longer periods of time, you are more likely to come back. Considering this information, BuzzFeed’s content strategy is well structured around clickbait. Their articles take 30 seconds to read, and provide you with numerous paths to new ones.

Within society the general notion is that clickbait is bad. People don’t like it, and this is proven simply by the cautious name of ‘clickbait’. Being baited into anything is usually considered a negative, like a fish to a hook. From what I read on this topic, clickbait is generally considered a bad marketing strategy, however it can be used extremely effectively. As societal outcry against clickbait increases it becomes less viable. For example Facebook and Google, the two largest content surfing platforms on the web, both take extensive measures in preventing spam / clickbait titles from appearing heavily on their platforms (although neither is successful at preventing it).

Resources:

Haile, Tony. “What You Think You Know About the Web Is Wrong.” TIME, TIME, 9 Mar. 2014.

Khoja, Nadya. “7 Reasons Why Clicking This Title Will Prove Why You Clicked This Title.” Venngage, Nadya Khoja, 23 Feb. 2016, venngage.com/blog/7-reasons-why-clicking-this-title-will-prove-why-you-clicked-this-title/.

Phillips, Tom. “13 BuzzFeed Headlines that Should Really Exist.” BuzzFeed, BuzzFeed, 13 Jan. 2015.

Shifting Power in the World of Streaming Services

by Cameron Welch

What does the Netflix crisis mean for consumers and other streaming and/or production companies?

“Netflix’s upcoming content crisis, in one chart” by Todd VanDerWerff details the seemingly-dim future of Netflix as a streaming platform and production company. Recently, Netflix has been desparately trying to make ends meet by producing original show after show. It’s struggling to hold on to its value- streaming shows like Friends and The Office (U.S) – while companies like Warner Media and NBC Universal slowly let it bleed out.

The graph above, provided in VanDerWerff’s article, shows that although Netflix has been creating its own shows lately, the top viewed shows are still those owned by other production companies. To the average consumer, it may seem like Netflix has the ball in its court, being the most popular streaming service available; However, Netflix is in trouble.


“And as more and more media companies increasingly view Netflix not as a way to make money off their older shows while getting those shows seen, but as a competitor, the value of those shows only goes up — as a recent $100 million deal to keep Friends on Netflix for a single year suggests.”

VanDerWerff

As the price continues to rise for Netflix to keep streaming other companies’ shows, like Friends, its chance for sustainability grows slimmer. As a streaming platform, Netflix holds value to companies like WarnerMedia because they still make the profits off of sales since they own the shows. As a production company, Netflix is not as appealing to partner with because now their new, original shows are competing with the other shows they stream. What’s the solution that production companies are coming up with? Of course, creating their own streaming platforms. It gets rid of the middle man, Netflix, and allows them full control and profit off of their own shows. For example, if WarnerMedia wants to take Friends and only allow its own streaming service to show it, people might leave Netflix and subscribe to this new service with Friends as the bait, as VanDerWerff suggests.

What does this mean? Why should the average consumer care?

Imagine a world in which you want to watch Friends. You log into Fox’s streaming service, search “Friends”, and it’s not there. “Okay, wrong one”, you say to yourself. Next, you try NBCU’s service… but you are wrong again. You might just want to keep a list of which of your shows are streaming where… and make sure to keep up on all those bills to pay for your 7 different streaming services monthly.

Although that’s a theoretical situation, things will nonetheless get confusing and frustrating for consumers. Having one streaming service (or more for those who enjoy HBO, Hulu, etc…) has made watching favorite T.V. shows and movies very easy. Having everything in one spot, in any situation, generally tidies up confusion and eliminates extra effort. With Netflix falling off of its throne in the streaming world and big production companies pulling their top shows back and opening up their own, private services, that extra effort and confusion will take its place during the transition of power over T.V. and movie streaming rights.

It’s not too late for companies to drop out or join the race

Other companies that might have goals of becoming part producers and part streaming platforms might want to reconsider. If it’s too difficult to maintain being a middle man between consumers and production companies, and a company as successful as Netflix is even falling short, it doesn’t look like a bright future for pure streaming platforms. On the other hand, this could be an opportunity to turn the situation around and join the streaming competition. If Netflix is struggling and losing rights to stream shows, it could be possible that other companies could swoop in and get the rights for themselves. This would still be expensive, but it’s a possiblity for some of the other streaming services that are doing well, like Hulu, or even game console companies, like PlayStation and Xbox. In times of a power shift like this one, there’s usually an opportunity for new companies to gain more leverage.

Personal reaction to the crisis

When I first read VanDerWeff’s article and saw the graph he provided, I was really shocked that Big Mouth and Black Mirror, the only two shows included that Netflix fully controls, were so low on the popularity list. A large number of my friends and colleagues watch those shows, as well as the ones throughout the whole entire ranking, and I expected them to be more popular. The shows that appear on the graph only account for a very small number of all available media from Netflix, so I understand that even having a .5% for all views in a year is not too shabby.

I agree with VanDerWeff’s claim that there is in fact a crisis for Netflix and their future could be dim to zip. Although this isn’t the end of the world, Netflix is a very important part of pop culture right now because the movies and T.V. shows it streams allow people to connect to one another in a social realm. The generations of now value quality entertainment, comfort, and easy access, and Netflix has provided that thus far. As consumers, we can only hope that the future of streaming services and television/movie production won’t let us down.

Sources:

VanDerWerff, Todd. “Netflix’s Upcoming Content Crisis, in One Chart.” Vox.com, Vox Media, 7 Jan. 2019, http://www.vox.com/culture/2019/1/7/18166911/netflix-friends-the-office-crisis.

Can We Trust the Polls?

I recently had a conversation with a friend about the ongoing government shutdown. I pulled out my phone and pulled up the FiveThirtyEight website to look at Trump’s approval rating. My friend looked at me and said, “Yeah, but you can’t trust the polls.” I was initially set back by her response – FiveThirtyEight has a reputation for providing reputable data and tracks Trump’s approval rating based off of a collection of all polling data weighted by methodological standards and historical accuracy. How could she dismiss their work so readily? Then I remembered the dialogue that perpetrated the media after the election in 2016. After Donald Trump won the election many people were asking how the polls could miss the mark. People felt like the polls had betrayed them — just look at these articles from USA TodayThe New York Times, and Politico.

Many people asked how the polls could have gotten it so wrong, but the short answer is that they didn’t. The national pre-election polls in 2016 indicated that Hillary Clinton would win the popular vote by a 3.3 parentage point margin. In the end, she won the popular vote by a 2.1 percent point margin. According to FiveThirtyEight data analysts, Carl Bialik andHarry Enten, a 2 to 3 percent polling error is fairly standard, which puts the national polls well within the margin of error. This error is also enough to account for Clinton’s loss in the Electoral College.

The majority of problems with polling in 2016 was on the state level which, according to research conducted by the Pew Research Center, “missed a late swing to Trump among undecided voters, and who did not correct for the fact that their responding samples contained proportionally too many college-educated voters (who were more likely to favor Clinton)”. Although these problems lead to an overstatement in Clinton’s lead and her position in the electoral college, they were never outside the realm of the standard statistical errors we have seen in electoral polling in the past.

Image taken from https://fivethirtyeight.com/features/the-polls-are-all-right/

But if the polls weren’t that far off base why were American’s so shocked by the outcome? 

I believe that part of that shock resulting from the 2016 elections was because of misdirected media representation and a general misunderstanding polling data. FiveThirtyEight contributor Nate Silver wrote that “Polls were never as good as the media assumed they were before 2016 — and they aren’t nearly as bad as the media seems to assume they are now.” The media narrative around election polling tends to focus on the numbers alone, commenting about who is in the lead, and not talking about the makeup of the poll itself. As a result, the general public is left largely unaware of what goes into election polling. The general public doesn’t understand the role response rates, statistical bias, collection methods, and other sources of error play into determining the precision of a particular poll. 

Instead of discounting the value of election polling it is important that we measure the value it offers against its limitations. We need to recognize that errors are not mistakes, but rather sources of uncertainty. Once we understand what creates that uncertainty we will be better equipped to understand polling data. 

Sources:

Nate Silver. “How Popular Is Donald Trump?” FiveThirtyEight, 20 Jan. 2019, projects.fivethirtyeight.com/trump-approval-ratings/?ex_cid=rrpromo.

Nathan Bomey. “How Did Pollsters Get Trump, Clinton Election so Wrong?” USA Today, Gannett Satellite Information Network, 9 Nov. 2016, www.usatoday.com/story/news/politics/elections/2016/2016/11/09/pollsters-donald-trump-hillary-clinton-2016-presidential-election/93523012/.

Lohr, Steve, and Natasha Singer. “How Data Failed Us in Calling an Election.” The New York Times, 10 Nov. 2016, http://www.nytimes.com/2016/11/10/technology/the-data-said-clinton-would-win-why-you-shouldnt-have-believed-it.html.

Shepard, Steven. “GOP Insiders: Polls Don’t Capture Secret Trump Vote.” POLITICO, POLITICO, 28 Oct. 2016, http://www.politico.com/story/2016/10/donald-trump-shy-voters-polls-gop-insiders-230411.

Carl Bialik. “The Polls Missed Trump. We Asked Pollsters Why.” FiveThirtyEight, FiveThirtyEight, 9 Nov. 2016, fivethirtyeight.com/features/the-polls-missed-trump-we-asked-pollsters-why/.

Kennedy, Courtney, and Courtney Kennedy. “Can Polls Be Trusted? Yes, If Designed Well.” Pew Research Center, Pew Research Center, 14 May 2018, www.pewresearch.org/fact-tank/2018/05/14/can-we-still-trust-polls/.

Nate Silver. “The Polls Are All Right.” FiveThirtyEight, FiveThirtyEight, 30 May 2018, fivethirtyeight.com/features/the-polls-are-all-right/.

“Sources of Error in Survey Research.” Qualtrics, 25 June 2018, http://www.qualtrics.com/blog/sources-of-error-in-survey-research/.

Utah Suicide Rates- and it’s Implications about Mormon Culture.

It’s generally a pretty well known fact to Utahn’s that the suicide rate isn’t great, and only continues to get worse. There’s been several theories about why this might be, from embarrassment to seek help, lack of friendship, to even juvenile court appearances. However, it’s also notable that even though there’s been several leads as to why Utah seems to have an ever increase rate of suicide, there’s been no significant results from any prevention programs. Something rarely implicated, if ever, is that Mormonism, it’s ideology, and the way that the church affects it’s members could be an underlying cause of Utah’s suicide rate. What does the data have to show for it? Where can we start looking at trends to see if there’s a correlation?

An interesting place to start is looking at trends pertaining to youth (ages 10-17), since in Utah suicide is actually the leading cause of death for this age group. This article by Hatch opens with “Utah suicide rates are skyrocketing and are now the leading cause of death for Utah youth. The youth suicide rate has tripled in Utah since 2007 — jumping from three out of every 100,000 youth to 8.5, an alarming increase not seen anywhere else in the country.” Utah in itself has one major feature that notably separates it from the majority of the other states- it’s population of Mormons, as mentioned formerly. As the LGBT movement increasingly surges for equality, is there a setback because of the conservative Mormon culture?

There’s definitely language on behalf of the faith that not only creates separation, but dehumanizes those in the LGBT community. An article by Lee Hale says “Often that role goes to The Church of Jesus Christ of Latter-day Saints, which calls homosexuality a serious sin. The Church even labels those in same-gender relationships as “apostates” whose children require special permission to be baptized.” With that attitude, added to the increasing LGBT agenda encouraging equality and LGBT people to be comfortable with who they are, it’s no wonder that Utah’s suicide rates aren’t fixing themselves. Maybe it’d be helpful to start including the LDS church in the possible culprits of the ever increasing and attention-demanding issue.

Making Informed Decisions – Genetic Components of Gender Dysphoria.

For the many that identify as transgender, gender identity is not merely a psychological condition to be treated. It is deeply rooted within who they are or feel that they are meant to be. Many of these individuals believe that their brains are male, female, or somewhere in between regardless of their genitals and the gender they were born as. Not too long ago this was the topic of a conversation I had with a friend who had undergone therapy for gender dysphoria. When the discussion turned toward the treatment of transgender children, I was asked about my opinion on conversion therapy. Although I hold a very strong opinion against it I had no scientific data, only a weakly supported argument based on psychological well-being to back up my point of view. This got me thinking. Is there information out there based on science that parents can use to make well informed decisions concerning their trans children?

In the past it was believed that gender dysphoria was largely psychological and linked to how a person was raised or due to traumatic childhood events. Although this view has been largely left behind, scientific data backing up a biological premise for gender dysphoria did not really exist until more recently. Research of this type is still in its infancy and there is much work to be done, however current data does support biological differences in transgender individuals.

In an article from New Atlas, Rich Haridy reports that a study published in the Journal of Clinical Endocrinology and Metabolism last year suggests that there is a genetic association with gender dysphoria. A team of researchers from the Hudson Institute of Medical Research in Australia looked at variants in genes associated with sex hormone signalling. The idea behind this study came from the recent pool of evidence indicating an increase in gender dysphoria among individuals who were exposed to abnormal concentrations of androgenic hormones while in the womb. This lead researchers to hypothesize that variants in certain genes could alter sex hormone signalling and cause a change in how the developing brain sexually differentiates, thus causing a person to experience gender dysphoria.

To test this theory the DNA of 380 transgender women and 344 non-transgender men was analyzed. The researchers looked for repeated DNA sequences in genes associated with sex hormone signalling. Their data identified 12 genetic variants in transgender women that are associated with the processing of male and female hormones (estrogen and androgen). On the Hudson Institute of Medical Research website the lead author of the study, Vincent Harley, explains, “these genetic variations could make some males less able to process androgen, causing the brain to develop differently – with areas that are less ‘masculine’ or more ‘feminine’ – which may contribute to gender dysphoria in transgender women”. This theory is supported by recent research findings that the MRI’s of individuals with gender dysphoria showed brain structures more like their desired gender than the gender assigned to them at birth.

In light of these findings, I can’t help but wonder what about transgender men? Do they also exhibit genetic differences in genes involved in hormone processing? This is a major pitfall to this study. Only transgender women were assessed, so a fully accurate picture can’t be painted with the limited data this study provides, but what it does do is open the doors for future research. Although the search for a biological cause of gender dysphoria has received backlash from some in the transgender community, Professor Harley sums it up quite eloquently by saying, “While it should not hinge on science to validate people’s individuality and lived experience, these findings may help to reduce discrimination, lend evidence towards improving diagnosis or treatment, promote greater awareness and acceptance and reduce the distress experienced by transgender people in our communities”.

So back to my original question, does current research offer valuable information to parents making decisions on what’s best for their transgender children? The answer is yes and no. Yes, there is scientific data that indicates people experience gender dysphoria because of a biological phenomenon and not some psychological defect. This in theory, could educate a parent to make better decisions concerning the therapeutic and medical treatment of their child, however the data is incomplete. The research, as aforementioned, is still in its infancy.

One final thought on this; even though this data exists, much of this research may not be easily accessible to the majority of the population. Parents looking for information may not have adequate access to research data and even if they do, they may have difficulty understanding the material. This in turn leaves us with another issue to ponder concerning the accessibility of scientific data. How do we make conscientious decisions concerning our health and the health of our children if we don’t have access to current research data?

Sources:

Haridy, Rich. “New Study Probes the Genetic Roots of Transgender Identity.” New Atlas – New Technology & Science News, New Atlas, 4 Oct. 2018, https://newatlas.com/transgender-genetic-study-hudson-institute/56631/.

Foreman, et al. “Genetic Link Between Gender Dysphoria and Sex Hormone Signaling.” OUP Academic, Oxford University Press, 21 Sept. 2018, academic.oup.com/jcem/advance-article-abstract/doi/10.1210/jc.2018-01105/5104458?redirectedFrom=fulltext.

“Written in DNA – Study Reveals Potential Biological Basis for Transgender.” Hudson Institute of Medical Research, hudson.org.au/latest-news/written-in-dna-study-reveals-potential-biological-basis-for-transgender/.

“Transgender Brains Are More like Their Desired Gender from an Early Age.” ScienceDaily, ScienceDaily, 24 May 2018, http://www.sciencedaily.com/releases/2018/05/180524112351.htm.