Does Peer-Reviewed Mean Reliable Data or Should We Be Skeptical?

Part of being a college student is learning to use peer reviewed articles to support ideas and claims in papers and research. Many of us hold the expectation that these articles are thoroughly researched and present trustworthy data. However, this is not always the case, as explored in the Vox.com article Let’s Stop Pretending Peer Review Works. In the article the authors question why scientists even bother with peer review if it doesn’t always produce reliable information. They highlight multiple studies with evidence that peer review doesn’t work much better than chance at allowing only high-quality studies to be published. This leads me to question how can we as students determine the reliability of peer-reviewed articles and data.

“The idea behind peer review is simple: It’s supposed to weed out bad science”  –Julia Belluz and Steven Hoffman

Many believe that peer review is a necessary means of quality control in research but others vastly disagree. In the aforementioned Vox article, Lancet editor Richard Horton is quoted to have said that peer review “is unjust, unaccountable … often insulting, usually ignorant, occasionally foolish, and frequently wrong.” There are many things that peer review does and doesn’t do, so I think both sides make valid arguments, but without a peer review process who knows what kind of data would be published. Assessing the quality of data cannot be easy. Peer reviewers don’t repeat studies or dig deep into every aspect of a submitted study. They surely can’t uncover every act of misconduct. However, that doesn’t mean that peer review is unnecessary.

Even though peer review doesn’t always work the good news is that bad science does get caught and retractions are made. However the implication of people reading bogus information is that the data is already out there and this can have lasting effects. For example, the research article that claimed vaccines cause autism was redacted, but the information had already been read and spread. Every once in awhile I still hear someone use that study as a reason for not vaccinating their children, but once information is out there it’s hard to take it back.

“Let’s stop pretending that once a paper is published, it’s scientific gospel” – Ivan Oransky, Medical Journalist

Many college students, including myself, will spend countless hours lost in peer-reviewed articles, so it’s important to keep in mind that the data presented may not be factual. While peer review isn’t perfect and we shouldn’t take research data that has been vetted through the process at face value, that doesn’t mean we should disregard it either. Just like with any data, peer-reviewed or not, we should remember that any information can be wrong. The best way to go about using the data we find in peer-reviewed articles is to remain skeptical and critically assess anything we intend to use and reference.

References Belluz, Julia, and Steven Hoffman. “Let’s Stop Pretending Peer Review Works.” Vox.com, Vox Media, 7 Dec. 2015, http://www.vox.com/2015/12/7/9865086/peer-review-science-problems.


U.S Low Ranking on the Oxfam Scale Despite Its High Income Status

An article featured in The Guardian “Which countries are the most (and least) committed to reducing Inequality?” written by Niamh McIntyre discusses country spending in relation to inequality. Oxfam and the Development Finance International researched and analyzed 18 indicators across 3 policy areas in 152 different countries to rank countries’ inequality levels. The countries are ranked according to the budget they spend on each policy area. The three policies the research focused on are taxation, social spending in areas including health, welfare and education, and labor rights. The United States is ranked out 23rd overall on the Oxford inequality index. The U.S spends 73% of its budget on social spending including social security, welfare and health (Desilver 2017), and has the highest corporate taxation rate out of high income countries. Why is the U.S on a low ranking for reducing inequality if it spends the most in two out of three policy areas? This analysis looks at high ranked countries on the Oxfam scale and highlights spending on policy areas between the United States and other countries showing inequalities despite the United States being a high income country.

Taxation is one of the policy areas that Oxfam measured, and corporate tax is a big component in how counties are ranked. Progressive structure and incidence on tax is also used. This metric is influenced by the Gini coefficient, which measures income distribution among a country. Corporate tax is a direct tax imposed on the income or capital of a corporation. Generally, countries are not seen to raise corporation tax, they have been declining. “The G20 average has declined 40% in 1990 to 28.7% in 2015” (McIntyre). Lowering corporation tax is seen as a disadvantage concerning countries’ inequality level. However, the United States has the largest corporate tax out of all major economies. Its corporation tax is at 39%, the highest percent corporation tax for high income countries. Sweden imposes 22% for corporation tax. Compared to the United States’ 23rd rank,  Sweden is ranked 1st for the lowest income inequality on the Oxfam level. This means Sweden has the lowest inequality rate out of 152 countries around the world. Yet, Sweden is ranked 8th in progressive structure and incidence on tax. This metric is influenced by their different policies . Comparatively, the United States may have a worse ranking not because of corporate tax imposed, but because of other factors such as falling wages. Countries with a lower GDP than the United States nevertheless rank higher, not because they impose a higher corporate tax as the article suggests, but because these countries tend to have a more progressive minimum wages. (McIntyre).

Another policy area the Oxfam research focuses on is social spending which includes health, welfare, and education. The rankings seem to be more focused on education spending as a means of measuring inequality and less focused on other factors such as welfare and health. According to the rankings, “High-income countries tended to fare much worse than low-income countries on education spending” (McIntyre). The United States ranked 25th in spending on health, education and social protection.  The lowest percent the U.S spent on education is 3%. Comparatively, Sweden spends 7.9% of its budget on education and Zimbabwe spent 29% of its budget on education.

The chart below shows results from Pew Research on how the United States spends its budget. While the U.S spends most of its budget on social services at 73%, this is divided into seven categories. Although Medicare is a large part of the budget of the U.S. it might not correlate to better health for Americans.

The Oxfam measurement does not take into account policies. Therefore, on a global scale it can be difficult to find the primary cause of inequality in each category. However, the lack of budget on education contributes to the bad  inequality ranking for social spending. The graph below visually represents different countries’ budgets on education. High income countries are seen spending less on education than low income countries.

Overall rankings for inequality levels on the Oxfam list were relatively high for high income countries, except the U.S, which had a low ranking. Although the United States spends a lot of money in two out of three policy areas Oxfam is concerned with, the ranking is still low due to a number of factors. The biggest factor that contributes to the U.S.’s low ranking is spending on education. Generally, low income countries spent more of their budget on education while high income countries like the U.S did not, but what pulled other countries like Sweden to the top of the rankings were taxation policies and labour rights. Higher wages, and smarter taxation laws contributed to Sweden’s better equality and the United State’s worsening equality.

References:

https://www.theguardian.com/inequality/datablog/2017/jul/17/which-countries-most-and-least-committed-to-reducing-inequality-oxfam-dfi

http://www.pewresearch.org/fact-tank/2017/04/04/what-does-the-federal-government-spend-your-tax-dollars-on-social-insurance-programs-mostly/

https://www.npr.org/2017/08/07/541797699/fact-check-does-the-u-s-have-the-highest-corporate-tax-rate-in-the-world

How Far Separated is Arts Education from Academic Education?

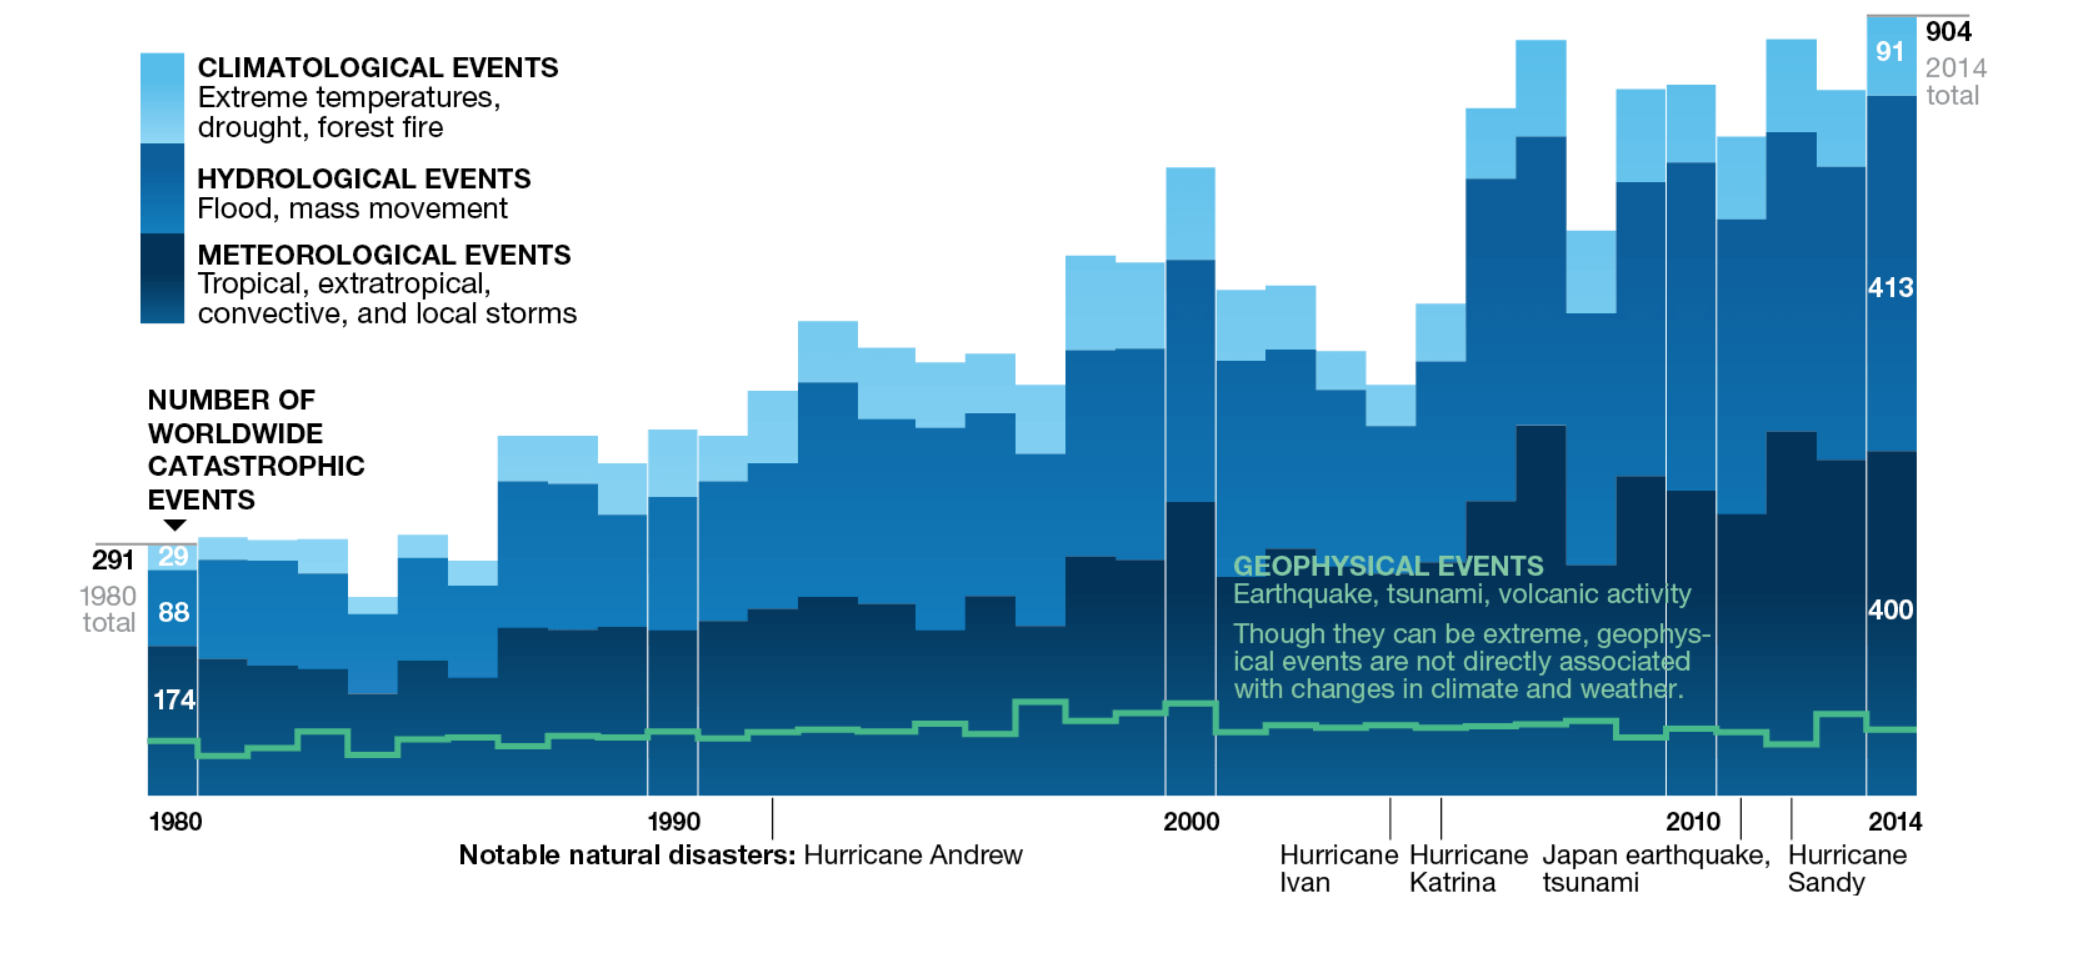
Many times the arts are overlooked in the educational system. Some school districts face financial budget cuts, threatening to erase arts education from the curriculum because they are deemed as having little relevance, value, or application in comparison to the academic subjects. Some argue even that they have little real-world applicational relevance at all. However, those who do study art know there’s just as much applicable value as science, math, computer science, engineering, physics, and anatomy. Though each art form doesn’t necessarily concern itself with the data that is tied to it, looking through an academic lens shows how much real-world application there is to art.

In school we learn that sound is caused by vibrations in the air, and that same idea can also be applied to music. Music is entirely mathematics, boiled down to it’s scientific essence. In Beethoven’s Moonlight Sonata, the first three notes consist of a D Major triad (meaning the chord consists of the root: A, a major third: F#, and a major fifth: D). “But these aren’t just arbitrary magic numbers. Rather, they represent the mathematical relationship between the pitch frequencies of different notes which form a geometric series.” Really what this means is that all music is a function of math and every single note can be graphed as a sine wave: the note A equals 440 Hz, F# equals 370 Hz, D equals 294 Hz. The relationship between a collection of notes (or chord) can be graphed to visually depict the consonance and dissonance. Every song, every note, every time someone hums a melody, the humming of your bathroom air vent, the chirping of birds, is the quantified presence of mathematics in the world, and those who don’t see the value of music don’t even realize it.

Dance is one of the more abstract art forms. However, even dance can also be reduced to physics and anatomy. Dance really is combinations of momentum, torque, friction, and an understanding of the center of gravity (especially in regards to turns). This video, posted by Ted-Ed, breaks down dance through the lens of physics incredibly well, “The fouetté is governed by angular momentum, which is equal to the dancer’s angular velocity times her rotational inertia. And except what’s lost to friction, that angular momentum has to stay constant while the dancer is on pointe. That’s called conservation of angular momentum. Now, rotational inertia can be thought of as a body’s resistance to rotational motion. It increases when more mass is distributed further from the axis of rotation, and decreases when the mass is distributed closer to the axis of rotation.” This equation can be summarized as L = Iω. Dance is a series of embodied physics, from the simple act of walking, to the complexity of turns, and jumps.

Another academic application of dance is anatomy. Understanding anatomy is crucial to a dancer’s career: anatomical familiarity prevents injury, can increase flexibility with stretching, and sustain the strength and longevity of the muscles and body. An excerpt from an article written for the International Association for Dance Medicine & Science shows just how vital anatomical knowledge is, “The psoas is one of the longest and most powerful muscles in the body, and it is ‘the only muscle that attaches to the spine, pelvis and femur’… Clearly a powerful source of energy of that sort, located right in the center of the body and attached to three anatomical unites that are most crucial to dance movement – the lower spine, pelvis, and hip joint – has to be respected.” This is only a small example of what anatomical insight provides, and dance requires far more to be an accomplished dancer. Knowing which muscles in your legs are used for your inner and outer rotation, how the hip flexors, hamstrings, and calves correlate to achieving your splits, or a deeper lunge, or a more extended battement is all rooted in anatomy.

On the opposite end of the spectrum, a more objective application of art happens to be technical theatre design. Scenic design is fundamentally based in mathematics and engineering. The theatre’s measurements are taken and reduced to a model size, the set is designed in proportion to the model and then enlarged to fit the size of real theatre in proportion to the model, all while needing to be functional, safe, and what the designer and director aesthetically agreed on. Mimi Lien, Tony Award winner for Best Scenic Design in a Musical for Natasha, Pierre, & The Great Comet of 1812 describes the relationship between what people consider ‘real-world skills,’ and her art, “People often ask me, ‘How did you find your way to doing set design from architecture?’ And I always think it’s a funny question because to me the tasks that I’m doing are exactly the same: building models and drafting. However, it’s almost like set design and architecture [are] the flip sides of the same coin, but with set design it’s a completely ephemeral thing.” Lighting design works with computers and light technology, using computer science to manipulate and shape light to create an effect onstage. It requires a knowledge of circuiting, calibration with the computer system and the lights, even how light reacts with fabric for costumes, and other layers of light.

The arts are just as, if not more applicable in the real world as any other subject. They have as much math and science applied as architecture, physical therapy, physics, engineering, etc. I would even argue that the arts are far more attainable to students in grade school than studying each STEM subject individually; students can learn how they apply to the real world more than just theoretical story problems, or labeling diagrams of the body, or physics abstracted in variables and numbers. The chasm between arts and STEM subjects isn’t as wide as we imagine and perceive them to be. They are integrally tied to one another, and are equally valuable.

Works Cited:

Schmitt, Jacob. “Working to keep the Arts in Public Schools.” Education Funding Partners, 17 July 2017. http://www.edufundingpartners.com/2017/07/17/working-keep-arts-public-schools/.

“Music and math: The genius of Beethoven – Natlya St. Clair” Youtube, uploaded by Ted-Ed, 9 September 2014, https://www.youtube.com/watch?v=zAxT0mRGuoY.

“The physics of the ‘hardest move’ in ballet – Arleen Sugano.” Youtube, uploaded by Ted-Ed, 22 March 2016, https://www.youtube.com/watch?v=l5VgOdgptRg.

“Functional Anatomy in Dance Training: An Efficient Warm Up Emphasizing the Role of the Psoas.” International Association for Dance Medicine & Science, 2011. https://cdn.ymaws.com/www.iadms.org/resource/resmgr/Public/Bull_3-2_pp13-17_Solomon.pdf. Accessed 10 February 2019.

Chow, Andrew. “2017 Tony Award Winners.” The New York Times, 11 June 2017. https://www.nytimes.com/2017/06/11/theater/tony-winners-list.html.

“Working in the Theatre: Scenic Design.” Youtube, uploaded by American Theatre Wing. https://www.youtube.com/watch?v=tXYX5YXjYaA.

“Working in the Theatre: Lighting Design.” Youtube, uploaded by American Theatre Wing. https://www.youtube.com/watch?v=wqMYsjHU5rU.

The Triangular Theory of Love

Love is a difficult emotion to describe, but that hasn’t stopped people from trying. Ray Bradbury wrote that “love is the answer to everything”; William Shakespeare wrote, “love is smoke”; Maya Angelou wrote, “Love is like a virus”; and Rabindranath Tagore wrote “Love is an endless mystery”. Poets, artists, and musicians aren’t the only people who have tried to define love — scientists have tried too. Yale Professor of Physiology, Robert Sternberg, attempted to define love be establishing a theory called the “Triangular Theory of Love”. According to Sternberg’s theory love has three components: commitment, passion, and intimacy. Sternberg goes on to describe how different stages and types of love are a result of particular combinations of these three components of love. This blog post will look at the Triangular Theory of Love and asses the flaws in methodology of Sternberg’s work. 

The Triangular Theory of Love breaks love down into commitment, passion, and intimacy which when isolated or combined reflect eight different types of love. These types of love include non-love, liking, infatuated love, empty love, romantic love, companion love, fatuous love, and consummate love. 

Source: https://en.wikipedia.org/wiki/Triangular_theory_of_love

Sternberg developed the “Triangular Love Scale” to determine which type of love a person is experiencing. Sternberg created a questionnaire with 72 questions that related either to commitment, passion, or intimacy and asked respondents to rate themselves on a 9-point Likert scale from “Not at all,” to “Moderately,” to “Extremely.” Sternberg conducted several studies to validate this scale, but the vast majority were conducted using similar methods. An advertisement was put in the news paper to gather participants, who would be given $10 for the time they spent testing. Participants were required to be involved in a close relationship, “primarily heterosexual”,  and between the ages of 18 to 71. Participants were then instructed to rate all of the 72 questions for six different relationships (mother, father, sibling closest in age, lover/spouse, best friend of the same sex, and ideal lover/spouse). Half rated them based off of the importance of each statement to the particular relationship, and the other half were told to rate them based on how characteristic each statement was.

Although Sternberg’s theory about love offers intriguing incites on interpersonal relationships, it illustrates the difficulties that arise from trying to define and measure love in standardized scientific terms. Self-reporting requires a significant amount of personal judgement calls, finding an appropriate and representative sample size is difficult, and because the Love Scale was structured as a questionnaire there were limited outcomes. there are a few issues with the methodology used in the Triangular Love Scale. The main issue with the scale is that Sternberg’s sample size was of a limited variety. Each of the participant were from the same geographical area. People who live in the same places are likely to experience similar cultural expectations regarding relationships. People in other areas around the world may rate the intimacy of a mother, father, or sibling in a different way then people who respond to a newspaper add in New Haven. In the first version of the study, the only participants were undergraduate students. This is a problem because undergraduate students are likely to experience things like romantic love in different ways than those of an older age demographic. Another issue is that each of the participants was required to be in a committed relationship for roughly the same duration of time. Sternberg believes that relationships change over time, but that isn’t reflected by the participants of the study. The Love Scale is also inherently heteronormative and polyphobic. This is reflected by the questions and demographic make-up of the participants of the study. I believe that the validity of the study could be enhanced if queer and polyamorous couples were included. 

The Love Scale was subjected to personal judgment calls, limited sample size, and close ended questions. These are common issues with quantitative research. In many ways Sternberg’s Triangular Theory of Love illustrates the difficulties that arise from trying to define and measure love in standardized scientific terms. We may never know exactly how to best measure love, but approaches like Sternberg’s can bring us closer to demystifying the emotion. 

Sources:

CBC. “Sci-Fi Writer Ray Bradbury Talks about Love, 1968: CBC Archives | CBC.” YouTube, YouTube, 6 June 2012, www.youtube.com/watch?v=If9hMwaGfdk.

“Quotes from Romeo and Juliet with Examples and Analysis.” Literary Devices, Literary Devices, 31 Oct. 2018, literarydevices.net/romeo-and-juliet-quotes/.

“Maya Angelou Quote.” A-Z Quotes, www.azquotes.com/quote/8513.

“A Quote by Rabindranath Tagore.” Goodreads, Goodreads, www.goodreads.com/quotes/154918-love-is-an-endless-mystery-because-there-is-no-reasonable.

Sternberg, Robert J. “A triangular theory of love.” Psychological review 93.2 (1986): 119.

Grohol, John M. “Sternberg’s Triangular Theory of Love Scales.” Psych Central, Psych Central.com, 8 Oct. 2018, psychcentral.com/lib/sternbergs-triangular-theory-of-love-scales/.

Sternberg, Robert J. “Construct validation of a triangular love scale.” European Journal of Social Psychology 27.3 (1997): 313-335.

What role does religion play in shaping children’s behavior and development?

The role religion plays in parenting is a commonly debated issue. Some parents argue that religion can be used as a tool to teach children compassion and respect. Others argue that children raised in religious households will have narrowed worldviews and weakened abilities for critical thinking. Does religion play a role in shaping the development and behavior of children?

A study published in Religions, an online journal, attempts to address how growing up in a religious household affects children’s development. The authors of the study claim that growing up in a religious home has both beneficial and detrimental effects on children’s development. According to the study, religiosity in the home improves children’s psychological and social development, but can be harmful to their performance on standardized educational testing.

 To conduct the study, the psychologists took data from when children were in kindergarten (to check the status of the religiosity of their household) and again in third grade to examine how religion impacted their behavior and development. The study was longitudinal, which is good for a long-term experiment testing for a correlation between different variables. The sample used in the study came from the Early Childhood Longitudinal Study- Kindergarten Cohort. The original sample included 21,260 children, and the authors claim that their sample is nationally representative. However, to remove a confounding variable, the scientists only included children in the study whose parents were married at the initial stage of data collection, when the children were in kindergarten. Because of this control, the sample size was reduced to 10,720 kids. Although this sample is smaller than the initial twenty thousand, it is still very large, which is a sign of a well-designed study. The authors don’t provide enough information about the sampling techniques to determine whether it is representative, which introduces some uncertainty into their results.

This table summarizes the observed results of the study. It shows whether each reported behavior supported each of the three hypotheses.

Reducing the sample size to control for the marital status of parents was just one of the confounding social variables that the scientists accounted for. The study also controlled for gender and race of the child, number of siblings under eighteen years old, family structure, family socioeconomic status, region, locale, and parents’ school involvement. By controlling for these variables, the study attempted to ensure that the changes in behavior were due to changes in the independent variable (religiosity) and not due to differences in the social variables listed above. Controlling for these confounding variables is a good sign that the study’s conclusions about the correlations between religiosity and children’s behavior are accurate. However, the scientists could not account for every confounding variable that might affect children’s behavior. For example, they did not account for the educational status of parents, for whether the grandparents were involved in the children’s lives, or for hundreds of other factors that could play a role in shaping the behavior and development of children. The study’s inability to control for other variables that shape behavior and development raises questions about the validity of their correlational conclusions.

Referenced:

Bartkowski, John P., et al. “Mixed Blessing: The Beneficial and Detrimental Effects of Religion on Child Development among Third-Graders.” MDPI, Multidisciplinary Digital Publishing Institute, 9 Jan. 2019, http://www.mdpi.com/2077-1444/10/1/37/htm.

Beating the Feynman Trap

One of the biggest downfalls of “Big Data” as it stands now is simply how broad, unorganized, and abstract it all seems to be.  In his 2019 article “The Exaggerated Promise of So-Called Unbiased Data Mining” Gary Smith highlights this problem, synthesizing it into something he calls the Feynman trap.  The Feynman trap, as defined by Smith, is the “ransacking [of] data for patterns without any preconceived idea of what one is looking for” (Smith). I can imagine it’s an easy trap to fall into.  How can we, researchers and society at large, leverage the technology we have when there is a near infinite amount of information to comb through?

The answer, in my humble history major opinion, resides in the definition of the Feynman trap itself.  As Smith says himself “good research begins with a clear idea of what one is looking for and expects to find [while data mining] just looks for patterns and inevitably finds some” (Smith).  So we have a “how”; In order for data mining to truly be useful, we need to be specific and targeted.

A great example of this kind of data mining can be found in a 2014 article titled “Data Mining Reveals How Conspiracy Theories Emerge on Facebook”.  In this study, researchers used data mining to analyze how much time users spent engaging with official media news outlets and alternative ones. The results indicated that, of a sample of 1 million Facebook users, the average amount of time spent engaging with mainstream news, official political channels, and alternative sources was approximately the same (MIT Tech Review).  I was amazed to find this study from 2014 dealing with a practical application for data mining that would be undoubtedly useful both now and in the future.

Lest we forget that there was most likely explicit meddling by foreign agents in both the 2016 American presidential election in addition to subsequent elections in Europe.  Imagine how useful data mining might be in observing and predicting the responses populations might have to this kind of interference. Imagine using data mining to counter or block attempts at digital meddling.  This kind of technology could be vital in securing the openness of information and political processes in the 21st century.

I’m sure people high above my pay-grade have already been considering these possibilities.  Or maybe not, after all, the study referred to in this blog is from 2014. Nevertheless, the point still stands.  If data mining wants to remain credible and useful in the rest of the 21st century, it needs to be able to move beyond its greedy roots.  Data can only be useful when given context. What does it matter if Bitcoin goes up if it rains in New England.  If data mining does not adapt, it may never escape the Feynman trap.

Sources Accessed:

Data Mining Reveals How Conspiracy Theories Emerge on Facebook” – MIT Technology Review

The Exaggerated Promise of So-Called Unbiased Data Mining” – Gary Smith

Changing Forecasts

In the past 100 years, Meteorology has advanced in what Washington Post Weather Editor, Angela Fritz, has called a five to one ratio, meaning that meteorologists can now predict a five-day forecast with the same accuracy as a one-day forecast 100 years ago (Dankowsky, 2019). Advances in computer and satellite technology allowed meteorologists to predict a five-day forecast with close to 90% accuracy, but it is still not a definite science. There is great variation between individual weather forecasts, and changing climate patterns will continue to make the process more convoluted.  How will climate change affect the accuracy of weather forecasting?

A weather model is created through a combination of concrete data points and mathematical modeling. Weather balloons and satellites collect meteorological data, including: air pressure, temperature, humidity, and wind speed, and then then equations based on current notions about atmospheric physics are used to fill in the gaps and make predictions.  The models, however, are not universal.  Different approaches to atmospheric physics result in different models, which in turn results in different forecasts from individual weather services.

Screen Shot 2019-02-03 at 10.10.19 PM

Trends show that there has been an increase in extreme weather events, such as: extreme temperatures, droughts, floods, and tropical storms. Most scientists agree that this trend will continue with climate change, but they differ in their belief in whether or not models will be able to keep up with the changes.  The answers to climate questions are based on averages. Actual weather results tend to be an average of all the forecasts made, and the models themselves are based on averages of historic weather data and patterns.  As climate change progresses and new and more extreme weather patterns emerge, the averages of the past 100 years may not be necessarily applicable, and the models of disparate weather services will continue to differentiate.

The field of weather forecasting is based on prediction derived from mathematical models and previous data.  As we are on the precipice of extreme change in climate, so is the field. Angela Fritz states that the physics of the atmosphere will not change unless something catastrophic happens, but as a meteorologist, her job security relies on her ability to predict the weather. UC Irvine Earth Science professor, Jin-Yi Yu, anticipates that the changes in temperature gradient in the arctic and changing patterns and temperatures in the oceans will be enough to alter atmospheric functions and make current atmospheric models irrelevant. Either way, the field must continue to develop, because as storms get larger and more extreme, the importance of accurately predicting their frequency will be of the utmost importance.

References

Dankowsky, John, host. “100 Years of Your Daily Weather Forecast.” Science Friday, NPR, 25 Jan. 2019. https://www.sciencefriday.com/segments/100-years-of-your-daily-weather-forecast/

“Global Warming Decreases the Reliability of Weather Forecasting Tools.” Phys.org, Science X Network, 19 Jan. 2018, phys.org/news/2018-01-global-decreases-reliability-weather-tools.html.

“5 Ways Climate Change Will Affect You: Wild Weather.” Nationalgeographic.com, The National Geographic Society, http://www.nationalgeographic.com/climate-change/how-to-live-with-it/weather.html.


What Major Will Make Me Happy?

Choosing a major is the hardest part of college. Despite everyone repeatedly telling you that your major does not definitively define your career, the process feels none the less scary. It’s a big commitment, and there is a lot of societal pressure to have your dreams hashed out as quickly and in as much detail as possible. There is a lot of advice out there for choosing your major. The list includes predicted job security, income, employment rate, overall satisfaction, personality compatibility and more. In the end, it is up to the individual which metric they want to use, as well as what field they are most interested in. However, for people who find themselves good at most things yet passionate about nothing, choosing a major is the most difficult question out there. My question pertains to the hardest metric to gauge in choosing your major; which option is likely to keep me happy in the long run?

A quick google search of this question leads you directly to this article from bestcolleges.com. While this article has lots of information pertaining to the metrics listed above, the chart I want to focus in is titled “Happiest Majors” about half way down the page. Below is the chart from the page, which takes the 25 most popular undergraduate majors and rates their recommendation levels from degree holders. The X axis represents the amount of degree-holding alumni who recommended pursuing each degree.

While the article argues that this table is an accurate metric for overall happiness with a major, I would argue that this data does not fully support that conclusion. The data answers a different question than was asked. If I want to know which college major will make me happy, asking degree holders if they recommend pursuing their own major might not be the best way to measure it. Whether or not a person recommends their major or field of study is independent of how happy that field makes them. They could be correlated, but many people choose fields for reasons besides happiness. They could also be recommending their field for monetary reasons for example. A better question might be to ask degree holders of each specific major whether or not they are happy with their choice, rather than give a recommendation as to whether or not it is a good idea. This question would provide us with better data, because it actually mentions happiness, the metric we are trying to gauge. Because happiness is so difficult to measure, subjective-experience based data is a good strategy. While recommendations may hint towards happiness levels of different fields, it is likely that they are heavily influenced by other factors.

Another issue with this data is the lack of context. Because very little is described about the data, it is likely being manipulated to make certain fields seem more attractive. The rest of the charts on this site, as well as this one, seem to have a clear bias against social sciences, arts, and humanities, while at the same time over-recommending STEM and business fields. The lack of context to the data is evidence for this bias. For example, the article never states that each line on the chart represents recommendation levels from people who graduated with that specific major. The only context given is that this data was gathered from degree holding alumni. This does not necessarily mean that the degree holder had a degree in the field they are either recommending or discounting. This lack of context makes it easier for the article to come to the conclusion that business and STEM fields will make you happier, without necessarily having to backup the claim.

For these reasons, I do not believe this article answered the question as to which college major will help a prospective student be happy. Admittedly this is a very hard question to answer, but you should not claim to answer it without sufficiently clear data. I believe that the conclusions made by this article are not fully supported by the data it provides, and that those conclusions are thus clearly influenced by bias towards STEM and business fields.

Are young women losing interest in motherhood?

While having kids seemed to be expected of young adults in the past, there appears to be a decline in the appeal of young-adult parenthood today, notably since the year 2000. According to the CDC, the average age for women births was 24.9 in 2000 and had increased to 26 in 2017. Are young women losing interest in motherhood? If so, why?

Mona Chalabi, a data editor for the Guardian US, writes about some of the everyday effects of young-adult parenthood for both males and females in her article titled Read this before you have a baby (especially if you’re a woman). According to Chalabi, women spend less time working when they have children under 7 than when they are without children. Less work means less income, and whatever is being earned most likely goes towards the well-being and care of the child. Not only do women sacrifice more money by having a child, but they also have less time for leisure, namely watching TV. Women with children spend fewer hours in a day watching TV than those who don’t. Having more money to spend on one’s self and time to focus on work and leisure are a few of the reasons that young women are choosing to wait longer to have children. Perhaps having children just isn’t as appealing to young women anymore.


“…if you’re a woman who enjoys paid work or relaxing activities, having kids will cramp your style” – Chalabi

Chalabi uses data from the CDC, a trustworthy, government organization that has many divisions, including the National Center for Health Statistics, Division of Vital Statistics, Reproductive Statistics Branch. She also utilizes the US Dept. of Labor’s American Time Use Survey which is, again, a credible government source. Aside from source credibility, she does something unique and highly valuable- she explains why she analyzed what she did and recognizes possible faults in her methods.


“Obviously averages differ a bit over the course of a week but for the purposes of this analysis, I just took the average day regardless of when it fell during the week or year” – Chalabi

When presenting data, it’s important to explain the process behind the analysis so that readers can trust the methods used and the results formed. Chalabi makes sure to inform her audience of the possible problems with the data in connection to her claims as well.


“Some of these differences could be explained by other factors like age – the older you are, the more likely you are to have children and maybe as men get older they spend more time at work but as women get older they’re less likely to (meaning that it’s the job and not the presence of kids that affects work hours)” – Chalabi

She repeats this tactic throughout each of the ATUS data sets that she analyzes. This ability to recognize uncertainty and alternative hypotheses makes Chalabi’s analysis more thorough and holistic, and therefore a better, less biased reference for answering questions with the use of data analysis.

Overall, Mona Chalabi’s analysis and synthesis of data from the American Time Usage Survey and the CDC holds value in its recognition of alternative hypotheses, uncertainty, and counterclaims, as well as its use of trustworthy, credible sources. Knowing this, it’s safe to say that there is significant evidence pointing towards young women feeling less inclined to have children today than at the start of the 21st century.

References:

Matthews, T. J., and Brady E. Hamilton. “Mean Age of Mothers Is on the Rise: United States, 2000–2014.” NCHS Data Brief, U.S. Department of Health and Health Services, Jan. 2016, http://www.cdc.gov/nchs/data/databriefs/db232.pdf.

Chalabi, Mona. “Read This Before You Have a Baby (Especially If You’re a Woman).” The Guardian, Guardian News and Media, 8 Dec. 2017, http://www.theguardian.com/news/datablog/2017/dec/07/datablog-children-parents-time-read-this-before-you-have-a-baby-especially-if-youre-a-woman.

Public Policy Priority Polls and Machiavellian Politicians

In a FiveThirtyEight article titled “What Issues Should Democrats Ignore in 2018”, Micah Cohen attempts to bring into reality the tweeted statement of Nate Silver, ”Everybody always writes columns about why Democrats or Republicans should pay more attention to issue X. It would be actually way more useful if people wrote columns about what they should pay *less* attention to” by combining data from the Pew Research Center and a Gallup poll. His results are of no worth towards a discussion, as they are merely opinions. However, this topic of federal candidates picking and choosing issues in a political landscape based on statistically based priorities leads me to ask, how does releasing this poll data affect the election outcomes? Preying upon public priorities is a harrowing tactic that reinforces politics as a game in which winning is the sole prerogative (i.e. in which the end justifies the means of acquiring the end). We need not look any farther than the House of Cards character, Frank Underwood (or Donald Trump) to understand what this kind of systematic republican campaigning technique will invoke. Or, take Machiavelli’s advice to the princes of Italy, “Appear as you may wish to be”. In the same manner that Machiavelli advised the prices to prey off the idealized virtues of the masses, so too are we encouraging politicians to prey off what’s important to us, and informing them of what to avoid in order to win without giving up their authentic self, character, or topics of expertise or passion.

An example of public polls on priorities is from the Pew Research Center, one of the largest and most influential research institutions in the US.

This image has an empty alt attribute; its file name is 012518_2.png

http://www.pewresearch.org/fact-tank/2018/01/29/state-of-the-union-2018-americans-views-on-key-issues-facing-the-nation/

I may be in a minority, but I was not polled. The methodology of this survey does not include how many people

I will concede that it appears beneficial to inform our elected or campaigning body on what we as a people prioritize. However, we must consider who is represented in these polls and how the demographics who vote may misrepresent the priorities of minority groups. It is better to hear someone speak and make a decision on whether or not they are the right vote for you, than to tell someone what you want to hear, have hem say it, and then vote for them because they said what you wanted them to say. Using Trump as a convenient example, Politifact revealed that as of now Trump has only kept 16.7% of his campaign promises, as compared to 17.6% of his campaign promises that have been broken. Empty promises for which align a candidate with your values that never come to fruition.

We as a people must learn to subvert the advice Machiavelli gives. For, as he advises the prince to appear virtuous (generous, compassionate, etc) but not be virtuous, we should watch out for those who seem without flaws, or are perfect in everyway and yet never fulfill their promises. We must examine the unexamined.

All we get from encouraging politicians to speak to us on what we want to hear is a vacuum. The person elected is a complete stranger who’s power is derived from their popularity, and no other metric. When our political offices are filled with those appealing to our priorities while in reality pursuing their own, we end up with our current executive administration. In no occasion do I see it fit for the prey to provide the predator with the tools to exert as little effort as possible in advancing.