How Big Data is Cementing Inequality

Our society has an inequality problem that spans across (arguably) every industry. Healthcare is towards the top of the list of industries affected by inequality not only because it perfectly demonstrates the issue, but because it is an essential part of human health and well being. In the United States, it is well accepted that racial minority groups receive lower quality healthcare than dominant groups. Not only do these groups feel discriminated against in healthcare settings, but they are also less likely to receive preventative care (Egede). However, as new technologies develop through the analysis of big data, the healthcare field is making huge strides towards expanding public health. As the capabilities of the healthcare industry increase, we would hope that the benefits of these new technologies would be shared with all people. But are these new technologies, used in healthcare and other sectors, really benefiting everyone equally?

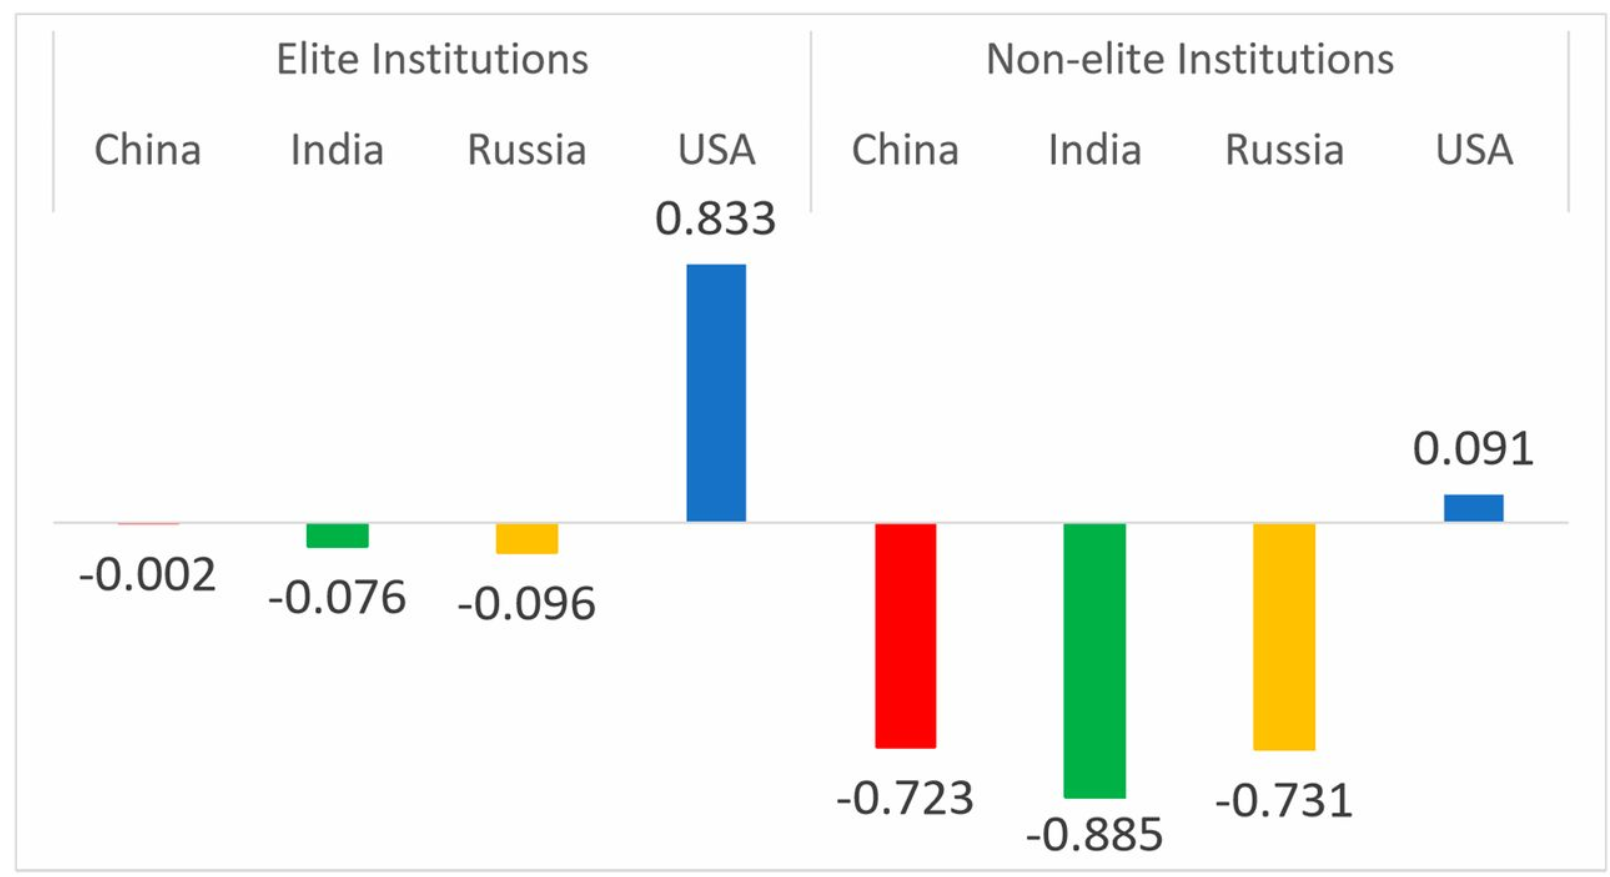
One of the new technologies in healthcare that utilizes big data is called PRS, or Polygenic Risk Scores. These scores are used to predict the risks for people developing certain diseases and to suggest preventative measures accordingly. One study, published in Nature genetics, demonstrates that risk predictions from the PRS are far more accurate for people of European descent. The risk prediction of the PRS is most accurate when there is minimal genetic divergence between the person having their risk tested and the genetic data being used. According to the study, 79% of genetic data comes from people of European descent, when they represent only 16% of the global population. Because of this overrepresentation of European descendants in genetic research, the PRS risk predictions for people who are not of European descent are not very accurate and therefore not very useful.

Figure 1: This figure demonstrates the differences in predictive power of the PRS technology between different ancestry groups.

These PRS tests cost only about fifty USD per person and can be very helpful in educating people about preventative healthcare measures. However, they are useless to a majority of the global population if we don’t work to ensure that all racial and ethnic groups are well represented during the collection of genetic data used to map these types of predictions.

This study is demonstrative of an overarching problem that comes along with the use of big data. Although technology that utilizes Big Data has the potential to be beneficial to a global population, a lot of it, like the PRS, is only valuable to select groups. These technologies, if further developed in the same way, will only exacerbate the inequalities that already plague modern society, and healthcare is not the only field exploring the benefits of these new algorithms. Technology that utilizes big data is being developed for almost every industry. Healthcare is joined by marketing, science, law, retail,and many more. In each of these fields there is already inequality, and if new technology is continued to cater to one group of people, not only will they remain at the top of the social hierarchy, but the gaps of inequality will grow.

Like the inequality gaps between racial groups, the gaps between people with varying socioeconomic status can also be expanded through Big Data tech. One mechanism to explain this trend is that not all competitors have equal access to Big Data. The companies that are able to invest in developing Big Data technologies are those that are already at the top of their sector: Google, Amazon, American Express, and other massive corporations. These companies are already monopolizing their industries, and their access to Big Data analysis has the potential to cement their dominance even further. Companies can use this new tech to determine customer demand better than ever before, and their prediction abilities will only increase as new technology is developed. This trend allows them to outperform competitors who don’t have access to Big Data. Small and local business owners already struggle to compete, and through new tech they will be left behind while the bigger corporations continue to grow.

As demonstrated by examples in two diverse industries, healthcare and marketing, Big Data has the potential to further inequalities that are already a huge issue in society. If Big Data is to be used in a socially just way, we need to ensure that it is taken for all groups, and is accessible to more than just the top 1%. If we don’t promote equality when Big Data is on the table, privileged and majority groups will further dominate, leaving many classes of people behind.  

References:

Egede, Leonard E. “Race, Ethnicity, Culture, and Disparities in Health Care.” Journal of General Internal Medicine. Blackwell Science Inc, June 2006. Web. 29 Mar. 2019.

Martin, Alicia R., Masahir Kanai, Yoichiro Kamatani, Yukinori Okada, Benjamin M. Neale, and Mark J. Daly. “Clinical Use of Current Polygenic Risk Scores May Exacerbate Health Disparities.” Sci-Hub. Nature Genetics, Apr. 2019. Web. 29 Mar. 2019

Are Nutritional Fats Bad?

A cursory survey of a google search of the same title will present thousands of results which are contradictory to each other. From NCBI articles to Buzzfeed articles, and from saturated to trans fats, there seems to be no common consensus regarding the effect of fats on our physical wellbeing. In this modest piece, I will not attempt to answer this question, but rather analyze the effects the onslaught of nutritional data can have on the general populace. The aspect I want to introduce as underlying the methodologies contributing to mass disinformation is the politicization of information and data to further one’s own end. This act is viewed in media groups, state advisory groups, and lobbying groups.

The essential feature we must address before moving forward is my claim of politicization. This first requires a definition of politics which is general to all and devoid of particular characteristics. This definition is that politics is simply the framing of an action through a value system. For example, legislation reducing the alcohol percentage in beer from 5% to 3.2% is an action that would not exist without values. But for values of LDS piety, or aversion to acts correlated with alcohol, the legislation would not exist. An essential feature of all politics is that all of life is political; that is, no action exists without a cause.

We are now experiencing the politics of nutrition, such as the FDA banning trans fats. While Forbes is a modestly respectable journal, no media news outlet is free from political action, especially when it comes to something as relatable and general as food. The action of publishing this type of article would not exist if it wasn’t for the values of making money, and while not evil in and of itself, the desperate pursuit of profit can lead to sensationalism in media.

The next aspect of nutritional politicization occurs in state sponsored advisory groups. As an established organization of a republican democracy (in the US), state advisory groups are an attempt to free the profit motive from information. However, state advisory boards, like all facets of life, engage in political action. Regarding saturated fats, the USDA writes that

Cut back on foods containing saturated fat including:

desserts and baked goods, such as cakes, cookies, donuts, pastries, and croissants

many cheeses and foods containing cheese, such as pizza

sausages, hot dogs, bacon, and ribs

ice cream and other dairy desserts

fried potatoes (French fries) – if fried in a saturated fat or hydrogenated oil

regular ground beef and cuts of meat with visible fat

fried chicken and other chicken dishes with the skin

whole milk and full-fat dairy foods

https://www.choosemyplate.gov/saturated-unsaturated-and-trans-fats

However, despite asserting that all of these foods should be avoided because of their association with fat, they have ignored that these listed products contain processed sugars, salt, and lactose (a form of sugar) which may impede your physical health as much as fats, possibly. The values of promoting the general welfare are only as good as the understanding of correlations is. See the AHA claiming that coconut oil is bad.

The final group which engages in nutritional politics is lobbying groups, who like media groups have a vested interest in framing actions through value sets. So much so that their salary depends upon it. Lobbying in the US is a billion dollar industry, and agricultural industries upon which fats are produced- both plant-based and farmed- are large industry with pecuniary interests. Its not a shock then that heterogenous products would be pitted against each other with the ease of exploitation the connotation of terms such as good and bad through marketing as well as lobbying.

Everyone is subject to political action. At its most fundamental level, every aspect of life is political. However, the action of using data to make a claim to your own benefit on a pecuniary basis has consequences which, least of all, result in an extreme general misunderstanding of a single topic. This is the case with fats. Are they good? Bad? Honestly, I do not know. There are simply too many vested interests making claims.

For more criticism on the politic of nutrition, check out this video!

The dangerous lure of (cheap) chiropractic services

A 2002 study published in the US National Library of Medicine National Institutes of Health stated that “Alternative health care was used by an estimated 42% of the U.S. population in 1997, and chiropractors accounted for 31% of the total estimated number of visits” (Coulter et al., 2002). Despite negative stigmas, high costs, and little scientific evidence supporting the effectiveness of chiropractic care, people continue use it as a mode of treatment. Why are people drawn to chiropractic care?

Chiropractic care is very expensive, costing between $30-200 per session depending on the quality and length of treatment and many other factors (Briones, 2017). Clinics realize that monetary cost is a concern, and so they might advertise as better than others due to their monthly plans, low rates, and in some cases the fact that they don’t require insurance. One clinic, the Joint Chiropractic, prides itself on all three of these highlights and even taps into more common concerns that people may have. ” This means fewer trips to the doctor, less time off work, and more money in your pocket where it belongs” (The Joint Chiropractic, 2019). While having low monetary costs, less trips to the doctor, and less time off work, and improved health all sound ideal and convenient, there are many risks to chiropractic care.

In terms of cost, chiropractors can charge more for their services if they have had more than the required 8 years of post-secondary education, trained others in administering care, or have more advanced tools and technology in house (Briones, 2017). With cheaper clinics, their practitioners may not be as educated and trained and they could likely be causing more damage to the patient’s overall health rather than benefiting them. A 2-5 minute “quick-fix” doesn’t always do the trick, either. More respected and usually more expensive clinics can offer a variety of options for care, such as radiography, diathermy, and thermography that focus on particular musculoskeletal issues with more time and detail than mere spinal manipulation, which might be what a patient needs.

“Saving up for or having fewer sessions with a more qualified, experienced practitioner would be much more worthwhile than receiving substandard care from a “discount” doctor” (Briones, 2017).

While convenience and affordability are important to consider in choosing a method of musculoskeletal adjustment or care, the reliability of a clinic and practicioner as well as the availaibilty of proper options for one’s needs are very important to consider. For some people, cheaper clinics with a 5 minute spinal adjustment might seem satisfactoy. If someone has a more severe condition, it’s likely they will need more specialized care and might feel satisfied with the quick chiropractic service but are not actually seeing an improvement in their overall health (placebo effect). This is significant because many people turn to alternative medicine or treatments with little to no scientific support for thier benefits. The convincing advertisements that claim cheap prices, extraordinary claims of overall improved health, and a quick fix catch many people in their webs. These patients could need more specialized or thorough treatment but instead are putting their money and the future of their health into a possibly less respected or scientifically backed service.

References

The Joint Corp. “The Cost of Chiropractic Care: Is It Worth It?” The Cost of Chiropractic Care: Is It Worth It?, 2019, http://www.thejoint.com/colorado/colorado-springs/colorado-springs-38002/193800-cost-chiropractic-care-is-it-worth-it.

Coulter, Ian D, et al. “Patients Using Chiropractors in North America: Who Are They, and Why Are They in Chiropractic Care?” Spine, U.S. National Library of Medicine, 1 Feb. 2002, http://www.ncbi.nlm.nih.gov/pubmed/11805694.

Briones, Danielle. “Cost of Chiropractic Care – Treatment Costs.” DocShop, DocShop, 6 Sept. 2017, http://www.docshop.com/education/chiropractic/cost.

Exploring Sexual Aggression

When I had my first sexual encounter, I was dating a person that I knew genuinely cared for me. However, some of the things he wanted us to do, or did without asking made me feel uncomfortable and sometimes I questioned if they were acts of sexual abuse. So I confronted him about them and his response was that he had seen them done so often in pornographic movies that he assumed they would be okay in a real life setting: that was how sex normally is. Women in heterosexual relationships or those who engage in heterosexual sex frequently find themselves in a gray place where they aren’t comfortable with what is happening, but shy away from labeling those acts as acts of sexual abuse or rape. We usually require a woman to fight back, or say “no”, and for the encounter to be violent for it to constitute rape. However, coercion and psychological manipulation are a big part of rape culture and all three of the above criteria might be absent in some instances of rape. In this blog post, I want to look into whether heterosexual men accurately understand the nuances of the acts that might constitute rape.

I looked at a study published in 2014 conducted on a group of 86 male college students with the mean age of 21, and standard deviation of 3.6 years. The study cited that there is a significant population of men who, when used specific labels, decline having raped anyone, but will admit to paraphrased questions such as if they have “coerced somebody to intercourse by holding them down.” The researchers try to find a correlation between hostility towards women and callous sexual attitudes with men that either admit to having intentions of raping, or men that will admit to paraphrased acts that constitute rape. Here, hostility is defined as the tendency to focus on negative interactions with women and to generalize them to all women. Callous sexual attitudes is defined as objectifying women and expecting men to have sexual dominance. The results show a correlation between men that show intentions to use force but deny the intention to rape with high levels of callous sexual attitudes, but not with hostility towards women. A disclaimer: the study does not tell us whether the men that participated had accusations of abuse or rape against them, so we are going to assume that they didn’t.

This is going to sound really bad, but I have to say it. Does using force to hold down a person and coerce them to intercourse always constitute rape? The researchers claim that it does. However, labeling such acts as rape as a third party observer takes away the power from the women in these situations as actors to identify their experience. The study seems to conclude its finding in a hedgehog manner by not looking at all of the other variables. For instance, all sexual acts occur in a physical setting, with at least two people involved. If the said sexual aggression is so prevalent, what do women do whether actively or passively in this physical space to promote or constrain violence? It is likely that if the women considered these sexual aggressions to be rape, they might have spoken against it, making the men in the study more cognizant of acts that might not be acceptable. I have found that it is not only socially accepted, but expected in an American school setting that women claim to like violent sex and big aggressive men, but as soon as a label such as sexual abuse or rape is thrown in, everyone shuns the said act. The ways in which we as a society talk about and think of sex as inherently violent might be a reason for high claimed intentions of rape. For instance, the indicators of “good sex” especially in heterosexual relationships include more violence than boring sex that everyone tends to joke about. So the men in the room that fail to accurately identify instances of rape might only be an extension of a bigger problem of how we view sex and gender roles as a society.

Additionally, people tend to think that college students have a lot of casual sex, but in reality, most sexual encounters still happen within a romantic/friendly setting. Are women who are romantically involved with their partner more likely to comply or fight back? Similarly, how does knowing the person outside of the sexual encounter affect men when they are making a decision to use or not to use force? A likely explanation for the study not being able to find a strong correlation between hostility towards women and men using force during intercourse might be because they happen within a romantic/friendly setting. And if women in these situations comply, is it because the dominant culture assumes that normal sex has some form of male dominance, or because they actually enjoy it?

An important place to go from here I think, is to identify sexual acts that might constitute rape, but aren’t violent and educating people about them. I think that this would allow a lot of women to acknowledge and understand the discomfort that they might feel in their heterosexual sexual experiences, and hence expand the accepted definition of rape. Moreover, even for women that genuinely enjoy these acts of force, I think it is important to investigate the longer term harm (if any) done by engaging in the said acts. It is important to not just label the behaviors as rape but to look at each individual scenario and let the women in them decide for themselves how they felt in those moments. But in the long run, I think we would benefit as a society if we changed the way we think and talk about sex, made it more inclusive of acts that are pleasurable to everyone, and challenged the power relationships we have outside of the bedroom.

How Do US Computer Science Programs Compare Globally?

I’ve been talking with friends a lot recently about the quality of higher education in the United States. From personal experience, I believe that overall that quality is very high. When I studied abroad in Scotland, I found the caliber of the computer science program there rather lacking; and from talking to other students who have studied abroad this seems to be a commonality in terms of experience of US students who set out overseas. In many other countries, much less is expected of students. Specifically in Scotland, there are less deadlines, there is often less classroom time, and less assignments and mid term exams. Especially in relation to the liberal arts school I attend, final exams carried a far more significant weight abroad – usually 80- 95 % of the final course mark. This meant that throughout the semester, I was expected to learn mostly independently, and the institution was less responsible for my studies. While this approach likely works very well for many students, I found it uncomfortable. I was used to being policed into keeping up with my classes by following regular attendance, participation, homework, and exams. I still prefer that method, because it helps me stay up to date with my program. I am very happy with my computer science program here in the United States. This thread of thinking lead me to ask a related question: How to computer science programs compare globally? I want to know if I am being as well prepared to enter the competitive and fast-paced industry of computer technologies as students in other countries.

I found a research paper that does a great job of answering this very complex question. The paper is titled “Computer science skills across China, India, Russia, and the United States“; and reports a study that compares industry preparedness of seniors in computer science programs at both elite and non-elite school within Chine, India, Russia, and the United States. The study involved seniors from each school taking a two hour long multiple choice exam, with the following charts detailing the results of the analysis:


CS skills by elite and nonelite institutions: China, India, Russia, and the United States. Within each country, the mean estimate for elite institutions is higher than the mean estimate for nonelite institutions (China, P = 0.063; India, P = 0.174; Russia, P = 0.084; United States, P = 0.000). The mean estimate for elite institutions in China, India, and Russia combined is lower than the mean estimate for elite (ACT/SAT equivalent >1,250; approximately the top quintile) institutions in the United States (P = 0.008). Mean estimates for nonelite institutions in China, India, and Russia are each lower than mean estimate for nonelite institutions in the United States (P = 0.000). Mean estimates for elite institutions across China, India, and Russia are not statistically different (P > 0.100). Mean estimates for nonelite institutions across China, India, and Russia are also not statistically different (P > 0.100). Estimates reported as effect sizes (in SD units). Scaled CS examination scores converted into z-scores using the mean and SD of the entire cross-national sample of examination takers. As such, the overall mean of the standardized score across all four countries is zero. SEs adjusted for clustering at the institution (university/college) level.

CS skills across China, India, Russia, and the United States after adjusting for United States student’s’ self-reported best language. The mean estimate of CS skills among United States students (“All”) is substantively the same as both (i) United States students who reported their best language is English or English and another language equally (English/Bilingual: 94.4% of all sampled United States students); and (ii) United States students who reported their best language is English only (89.1% of all sampled United States students). The mean estimates of CS skills for each of these categories of United States students are higher those of China, India, and Russia (in each case, P = 0.000). Estimates reported as effect sizes (in SD units). Scaled CS examination scores converted into z-scores using the mean and SD of the entire cross-national sample of examination takers. As such, the overall mean of the standardized score across all four countries is zero. SEs adjusted for clustering at the institution (university/college) level.

While the results are somewhat unbelievable, there are several measures the researchers took to ensure strong, unbiased data. To create the test, they used several international standards for question generation, and also took several steps and checks to ensure the tests were translated properly into each country’s main language. They also conducted the exam questions in pseudo-code, to eliminate possible CS language skill barriers. The researchers also took measures to ensure that each student took the exam in a similar environment, and accounted for unmotivated students by removing scores of students who left 25% or more of the test blank. They also examined the data from a number of different angles in order to remove biases that may have existed within the exam. For example, the second chart (above) shows exam results from different categories of US students to account for the possibility that US students out-performed other countries because of substantial recruiting of the strongest CS students from other countries to US programs. This data shows that all US students performed better on the exam, regardless of their language origin.

I also like that the researchers only included the top 4 stem-major producing countries. This allowed them to conduct an intricate study where many different error-correcting measures could be taken. They did not need to work with data from every country, and such a scale of study would have been unmanageable. It was responsible to take a limited data set of the top four contributors to computer science students globally, and acknowledge that this is the case for the data. The researchers also acknowledge the limitations of using a small pool of countries to compare to US schools, especially considering the diversity between the selected countries China, India, Russia, and the US.

Overall I found this paper answered my question, and told me with seemingly reliable data that US computer science programs are indeed preparing their students well, perhaps even better than the international average.

DNA and Culture: They Are Not The Same

Ancestral DNA analytics platforms such as Ancestry have given people information on their geographical history as well as rough percentages of racial association, however, this practice is inherently problematic both in its methodology and results. Sites such as Ancestry compare one’s genetic data multiple times across hundreds of regions to determine the strongest DNA markers which then constitute an ancestral DNA timeline. Unfortunately, individuals in power have used these results to demonstrate their association with peoples of indigenous regions when heritage is much more complicated than DNA. A prime example is senator Elizabeth Warren, who has used her DNA results to claim a status as a Native American on legal documents to fulfill diversity quotas for her law school, and to win a wager against Trump who denied and mocked her Native American heritage. Although Warren does have Native American ancestry (she is somewhere between 1/32nd and 1/1,024th Native American), it is her proclaimed association with the Native American culture that is problematic. To better understand the culture behind the DNA samples, we must recognize the consequences of this type of data.

“As Vox’s Dylan Matthews explained in February, Warren has consistently said that her mother is part Cherokee, even though Warren herself isn’t an enrolled member of the three federally registered Cherokee tribes. Her ancestors don’t appear on the Dawes Rolls, an official list of members of the Cherokee, Choctaw, Creek, Chickasaw, and Seminole tribes put together in the early 20th century.”

(Stewart, 2018)

Let’s begin with simple definitions of culture and DNA. DNA is merely a combination of nucleotides that make up a living organism, while culture is “the customs, arts, social institutions, and achievements of a particular nation, people, or other social group” (Google Dictionary). Ancestral DNA testing relays very little information besides a crude geographical estimate of where our ancestors stood for a period of time, and must not constitute as means of a connection or relationship with the cultures displayed in the analysis. As the quote relays above, Warren has no substantial relationship with the Cherokee tribes, and should not be using her smidgen of ancestral DNA to establish her political platform. Once those individuals in positions of power begin to lay claim to ancestral and cultural ties that are not apparent, then other cultures begin to be appropriated.

It is imperative that ancestral DNA not be equated to culture for the sake of cultural sovereignty and differentiation. Simply because my nucleotides are similar to those of a different race and/or culture in history does not justify my place in that culture if I am not actively participating in that culture, or am merely using the status for a personal/political/social gain.

The reason this type of data is so tricky is because it has to do with personal identity. The title DNA analysis makes it seem as if this data will tell us who we are, when in reality it simply tells us where we have probably been. DNA is what we are made up of, while culture influences who we are. The intermingling of these two worlds has allowed for people like senator Warren to claim status as a woman who has Native American DNA, but nearly no cultural connection to said culture. The results of DNA testing being used as political rhetoric is absurd and inconsequential because minority cultures have no political power to speak out or influence the issues. For the sake of cultural and to save the sliver of respect other cultures/countries may have for the U.S. we need to draw the line between DNA and culture and see the differences between them as an opportunity to learn, and not as a method of establishing a connection to those who we may personally know little to nothing about.

Resources:

Stewart, Emily. “Elizabeth Warren Releases Her DNA Test Results and Dares Trump to Make Good on His $1 Million Bet.” Vox, Vox, 15 Oct. 2018, http://www.vox.com/policy-and-politics/2018/10/15/17978258/elizabeth-warren-native-american-claims-dna-test.

Jumping the Electoral Shark

For months after the 2016 election, there seemed to be no shortage of articles and think pieces about how the national polling apparatus failed to predict the Trump win and how this failure was a result of inaccurate polling methods. And now, just over two years since the failure of these polls, the media is gearing up for 2020 will a host of predictive polls that read more like fanfiction than hard data (but hey, at least we know that Joe Biden has a seven point hypothetical lead on Trump).  So, before the storm of polls begin to dominate the 24/7 newsroom, I figured I would try and figure out how polls are conducted, how conclusions are drawn from them, and if we can even rely on polls at all. I’m sure I’ll answer all of these in a two page blog post.

The primary method used by pollsters and publications alike to conduct polling is described by Nate Cohn in his article “Why Did We Do the Poll the Way We Did“. This method, called “random digit dialing”, is exactly what it sounds like. Random phone numbers are dialed until someone picks up and participates in the poll. This is, of course, not the only way to conduct a poll. Cohn explains that for the titular poll in question, the team over at the New York Times utilized registered voter profiles to gather their phone numbers. Already we can see the problems inherent in conducting polling, not just political polls either. All polls depend on there being a willing population of pollees for the pollsters’ analysis to of any use. Even if a poll satisfies all the basic rules of modelling in statistics (Random, 10%, Success/Failure) there is no guarantee that it’s accurate, all data gathered from polls is various shades of inaccurate.

Analysis is a whole different issue. Was the population composed of all possible phone numbers or just registered voters? What was your line of questioning? Were your questions leading? Might the pollees have been giving you “polite” answers? And once you have your data, whose to say that the reality of the situation hasn’t already changed? It is, in short, an incredibly difficult. I think this fact is really put on display when you see hardcore analysts just as uncertain at this point as anyone else.

In a March 20th podcast, the folks over at FiveThirtyEight.com discussed Trump’s re-election. Some, like Geoffrey Skelley makes the claim that, at present, “econometrics models” place Trump as a possible favorite for  re-election. Others, Nate Silver specifically, are not so certain Trump’s economy can make up for the fact that his approval rating is sitting around 41% or 42%. The discussion goes around and around and never quite lends the listener a real sense of certainty.

Don’t get me wrong, there is still more than a year before anyone heads to the ballot box to cast a vote, so I don’t fault FiveThirtyEight or anyone else for not having some bold assertion about the result of the 2020 race. However, both politicians and voters rely on polls to make decisions, the former using them to determine if they should run to begin with and the latter deciding if their vote will be any good. But if decisions are being made based on faulty info, decisions can be made prematurely.

In the realm of polling, I find myself inclined to believe E. J. Dionne and Thomas E. Mann in saying that “Polling is a tool, not a principle“. I think that polls obviously have a necessary and permanent place in our political discourse. To suggest that polling should be done away with completely is far too naive (even for my tastes). What is important however, is that both politicians and citizens understand the deficiency in the polling apparatus.

Here’s Batman agreeing with me

Sources Accessed

“Polling and Public Opinion” – E. J. Dionne and Thomas E. Mann

Why Did We Do the Poll the Way We Did?” – Nate Cohn

“What Do We Know About Trump’s Re-Election Chances So Far?” – FiveThiryEight

Crash Test Dummies

In 2017, in the U.S., 12,500 men were killed in motor vehicle accidents, compared to 5,151 female drivers (NHTSA, 2018).  Overall, men are more likely to participate in risky driving behavior, such as speeding, driving while intoxicated, and not wearing seatbelts.  However, in crashes of the same severity, women are 47% more likely to be seriously injured and 17% more likely to die than men (Criado-Perez, 2019).  Why, in the same car crash, are women more likely to be injured than men?

The short answer is male modeled crash test dummies.  The most commonly used model for crash test safety is an average male.  This figure is often taller and heavier than the average woman.  It also does not account for differences in anatomy, especially different pelvis sizes.  In addition, there are differences in driving style.  Because women have shorter legs, they have to sit closer to the steering wheel. As a result, women’s bodies react differently on impact.  In a 2012 study, Swedish researcher Anna Carlsson found that women’s bodies propel faster in a collision (Carlsson, 2013).  The study took men and women in the 50thpercentile for mass, and tested for movement of the head and T1 vertebrae between the two groups at different changes of velocity.  Statistically significant differences head movement were found at 4, 5, and 7km/hour.

graph.png

It was not until recently that this problem began to be addressed.  Beginning in 2011, the federal government has made requirements for the use female proportioned crash test dummies in some vehicle safety testing. The law now requires front crash testing to be done with a 95% male (only 5% of population is larger) and a 5% female dummy (only 5% of population is smaller).  This drastically changed the safety rating for many cars that previously had five-star crash test ratings, even though their designs had not really changed

The more complex answer to the question is ingrained cultural bias. Car safety testers do not overtly want women to be injured. However, they are still being overlooked. Because it is often males designing supposedly objective algorithms, women are often still not considered, and it puts them at risk.  This sort of data bias is not limited to crash test dummies. When female police officers wear ill-fitting body armor, designed for men, they are not able to perform at their job as efficiently (Criado-Perez, 2019).  There are many ways that living in a world designed by men, for men creates data bias and puts women at a disadvantage.  The solution is more diversity.  We need a wider variety of people with different backgrounds designing and developing products and services to better meet everyone’s needs.

References

Carlsson, Anna, et al. “ADSEAT – Adaptive Seat to Reduce Neck Injuries for Female and Male Occupants.” Accident Analysis and Prevention, vol. 60, Nov. 2013, pp. 334–343. EBSCOhost, doi:10.1016/j.aap.2013.02.043.

Criado-Perez, C. (2019). Invisible women: Data bias in a world designed for men. New York: Abrams Press.

Starr, M. (2012, August 24). World gets first female crash test dummy. Retrieved from https://www.cnet.com/news/world-gets-first-female-crash-test-dummy/

United States, U.S. Department of Transportation, National Highway Traffic Safety Administration. (2018). Crashstats.nhtsa.dot.gov.

Are Gun Deaths and Gun Laws Related?

After a shooting, there seems to be a clear divide in sides about what the cause was and how to respond. In light of the recent shooting tragedy in Christchurch, New Zealand, it seems like this topic is evermore prevalent: how do we decrease gun violence, not only in America, but in the world?

New Zealand is a frequent example for the USA’s National Rifle Association (NRA) to use in explaining why gun laws don’t have an effect on gun violence. Guns are very prevalent to have in New Zealand- “In New Zealand, civilians hold about 1.5 million firearms, averaging out to about one gun per three people in a country of about 5 million” (Washington Post). Yet, in the aftermath of this massive shooting, their Prime Minister Jacinda Ardern declared that there’s going to be a change in gun laws: “Prime Minister Jacinda Ardern addressed the public Friday evening local time, calling it ‘one of New Zealand’s darkest days.’ Hours later, on Saturday morning, Ardern announced that New Zealand’s gun laws would be changed, as she confirmed that the attacker held a firearms license” (Washington Post) That said, she took a clear stance on the cause: lax gun laws. But are lax gun laws really the cause of gun deaths? Is media using data to give us an honest insight of whether or not gun laws are related to gun death?

As mentioned previously, there seems to be a very clear divide in the cause of frequent shootings and gun deaths, particularly in America. On one side, the argument is that gun laws have no impact on violent shooters; they are criminals, afterall. If they want a gun, they’ll be able to access that. In addition to that, it’s mental health that we should be focusing on. Then, on the other hand, there’s the argument that the problem is the availability of guns. Too much access means too many guns getting into the wrong hands. So… who’s right?

In looking for data, I analyzed several graphs and saw problems in nearly all of them. For instance, take this article from Vox.com, titled “America’s unique gun violence problem, explained in 17 maps and charts.” (Vox.com)
firearm_suicides_australia.0.jpg

The article here seems to be heavily biased toward stricter gun laws, yet all of the graphs are using the data to indicate things that aren’t necessarily represented by the data. This is a graph that’s supposedly arguing that Australia’s gun buyback program helped to decrease suicide by firearm, and therefore the country benefited from the program: the title of this graph was “. However, the data indicated that suicide by firearm was already on a downward trend before the program even started. Furthermore, it makes logical sense that if there’s less guns, there would be less suicide by firearm, since the supply is less. Yet this sample of data and several others are still used as propaganda to sway people on one side of gun legislation or the other.

When data’s used and interpreted correctly, it can be useful for troubleshooting on many issues. Realistically, there’s probably a variety data to support either side of the argument. However, it seems to be the case that facts are often taken by the media and manipulated to serve as persuasion, and especially on this partisan of an issue, it’s hard to tell what’s reliable and what’s not. To look back at the initial question, is media using data to give us an honest insight about gun violence’s relationship to gun laws? No. But looking at and interpreting data in an honest way for ourselves might be a good place to start responding to this difficult relationship.


Sources:

https://www.washingtonpost.com/world/2019/03/15/one-day-more-people-were-murdered-new-zealand-than-are-usually-killed-an-entire-year/?utm_term=.727726f7804f

https://www.vox.com/policy-and-politics/2017/10/2/16399418/us-gun-violence-statistics-maps-charts


119.5 Seconds

Approximately 13 million pints of Guinness are consumed on St. Patrick’s Day each year. This popular Irish stout is enjoyed in 150 countries and comes with a very particular 6-step process for creating the perfect pint. The crux of the instructions lies in the 119.5 (or 119.53) seconds that are required to let 3/4 of the pour settle before topping it off. According to Guinness, the wait is required to let the nitrogen bubbles “surge down the sides of the glass and up the center to form the head.” There are other requirements listed for the sequence of first sips to enhance the drinking experience, and of course the characteristic Guinness glass that the beer must be poured into. With all these requirements for the beverage, is the campaign for the perfect guinness drink a strong marketing tactic, or does it alienate the average beer drinker?

The company that owns Guinness, Diageo, first ran their “good things come to those who wait” campaign in 1998. This was the beginning of the advertisements focused on identifying specific traits of drinking a Guinness. A net increase of profits, specifically among older men, was reported for the next few years that was linked to their new branding. Between 2000 and 2005, Guinness attempted to change their branding to appeal to a wider audience, but their profits did not rise as much as they expected, so they reverted back to the “good things” slogan. A commercial titled “noitulovE” released in 2007 used the slogan and received “more awards than any other commercial in the world”and propelled the company to be the U.K. market leader for that year. Not only was it a successful year for Diageo, it also was a year of revenue decline in the U.K. beer market in general, which further highlights the importance of their advertising.

The Guinness Storehouse in Ireland which opened in 2000, has remained the most popular tourist attraction in Ireland and attracted over 1.7 million people between 2017 and 2018. At the Storehouse, visitors can sample beer, learn about advertising history, as well as learn how to correctly perform a 119.5 second pour and receive a “certificate
from the academy.”
The Storehouse has plans to double their bar size and attract even more visitors next year. The steady increase in tourism shows that the Guinness brand is still increasing in popularity, and that people are interested in the trademark culture.

The specificity and patience that is required of drinking a Guinness might be a welcome change in a high-powered world where we rarely take the time to appreciate the nuances of life. To some people, having to wait nearly 2 minutes for their beer to settle enhances the experience, but to others, watching your beer sit for 119.5 seconds just out of reach seems ridiculous. If marketing and profit history are any indicators, Guinness seems to have locked-in a dedicated fan base that expects a certain amount of prestige and ceremony to come with their 119.5 second pour.

References:
https://www.guinness.com/en-us/st-patricks-day/guinness-facts/
http://fortune.com/2017/03/09/guinness-st-patricks-day-pints/
https://en.wikipedia.org/wiki/NoitulovE
https://www.guinness.com/en-us/frequently-asked-questions/
https://www.forbes.com/sites/sujatakundu/2016/03/11/the-science-behind-pouring-the-perfect-pint-of-guinness/#1ceec4e5229b
https://www.guinness-storehouse.com/en/fourth-floor
https://www.thejournal.ie/guinness-storehouse-visitor-numbers-2-3775913-Jan2018/