Can Climate Change Collapse An Empire?

A team of geographic, environmental, geologic, and earth scientists (Stacy A. Carolina,1, Richard T. Walkera, Christopher C. Daya, Vasile Ersekb, R. Alastair Sloanc, Michael W. Deed, Morteza Talebiane, and Gideon M. Hendersona) sought to determine whether the decline of the first major civiliztion we know of, the Akkadian Empire, and an abrupt, transformative climate event were coincidental or correlated. According to their findings from analyzing archaeologic drought conditions and resulting increases in dust activity, the team’s work links the major climate event with the decline of the Akkadian empire as cause and effect.

The results of the teams research are established through marine samples from the northern read sea and the Gulf of Oman, and stalagmite core samples (GZ14-1) from
Gol-e-Zard Cave. These separate analyses were then synthesized into a comparative chart, posted below. The team compared their geographic and geologic “dust activity” results and regional climate patterns with existing archaeological findings regarding Mesopotamian settlements to show that the height of the Akkadian empire occurred when dust activity was lowest, and when drought conditions returned, the empire declines.
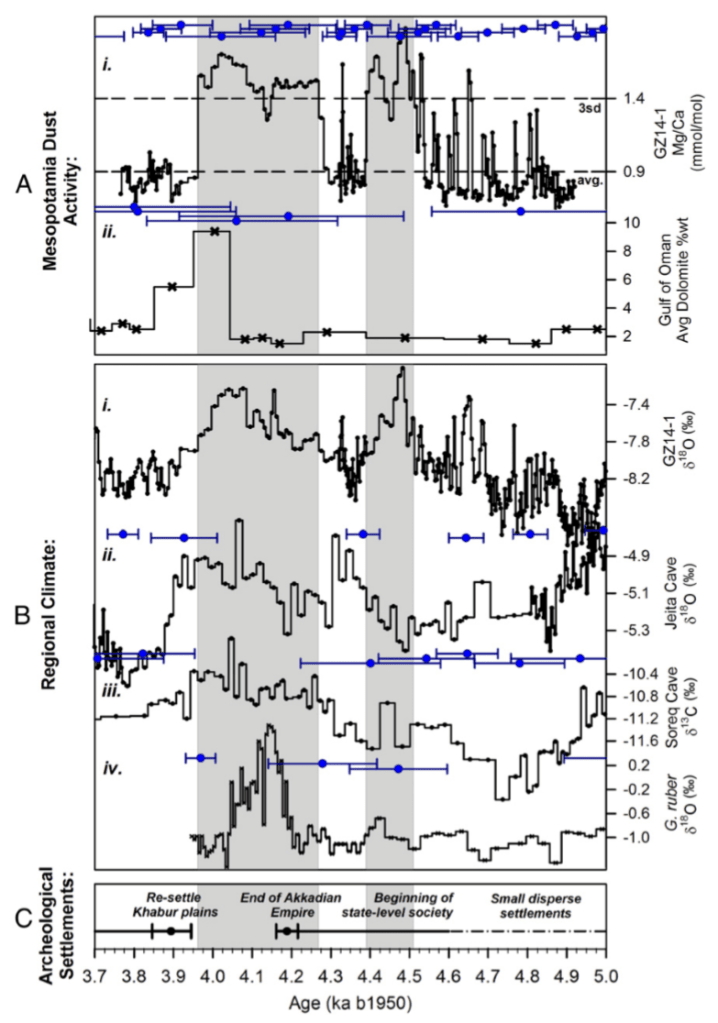
Graphical representation of the evolution of rain-fed agricultural settlements in north Mesopotamia, which became urbanized around 4.5 ka, were imperialized by Akkad around 4.26 ka, and then were suddenly abandoned at 4.19 ± 0.018 (1σ) ka (17), coincident with the decline of the Akkadian empire

https://leilan.yale.edu/sites/default/files/publications/article-specific/carolin_et_al_2018_gol-e_zard_pnas-1.pdf

The inverse relationship established by the researchers is further enforced by written evidence from the Akkadians themselves. In the Curse of Agade (Akkad), striking passages highlight the effects climate had on the success of the empire, and also shows that the people were aware of the effects of changing climate on their lives, because climate change has a direct impact on the production of food. So much so, that the effects of changing climate are personified as gods in the literary source.

the large arable tracts yielded no grain, the inundated fields yielded no fish, the irrigated orchards yielded no syrup or wine, the thick clouds did not rain (149-175)… May [Naram-Sin’s impiety] make the city die of hunger! May your citizens, who used to eat fine food, lie hungry in the grass and herbs (245-255)

http://etcsl.orinst.ox.ac.uk/section2/tr215.htm

Despite the research of the team, there is still skepticism regarding the causal relationship between climate change and ancient empire collapse.
Karl W. Butzer wrote in Collapse, environment, and society, that
“collapse is multicausal and rarely abrupt… Undue attention to stressors risks underestimating the intricate interplay of environmental, political, and sociocultural resilience in limiting the damages of collapse or in facilitating reconstruction.” While then we should restrain applying the causal relationship between climate change and empire collapse to all Old World cases, we certainly see that the case of the collapse of the Akkadian empire is an example of environmental cause-and-effect.

There is often a popularized notion that history is a devalued subject, worth nothing to those of us in the present. We see, in our modern age, the technological luxuries which ease the suffering of life and see history as floods of barbarians with no notions of the subjects which provide us comfort. This is simply not the case. Akkad was an advanced empire, spanning across the central middle east, with compex organization, trade networks, irrigation systems, and organized writing and information distribution. Akkad is in fact similar to modern empires, and we should take the wise advice of history- climate change can collapse even the mightiest empire because, without regard to other effects, we all need to eat.

Are Nutritional Fats Bad?

A cursory survey of a google search of the same title will present thousands of results which are contradictory to each other. From NCBI articles to Buzzfeed articles, and from saturated to trans fats, there seems to be no common consensus regarding the effect of fats on our physical wellbeing. In this modest piece, I will not attempt to answer this question, but rather analyze the effects the onslaught of nutritional data can have on the general populace. The aspect I want to introduce as underlying the methodologies contributing to mass disinformation is the politicization of information and data to further one’s own end. This act is viewed in media groups, state advisory groups, and lobbying groups.

The essential feature we must address before moving forward is my claim of politicization. This first requires a definition of politics which is general to all and devoid of particular characteristics. This definition is that politics is simply the framing of an action through a value system. For example, legislation reducing the alcohol percentage in beer from 5% to 3.2% is an action that would not exist without values. But for values of LDS piety, or aversion to acts correlated with alcohol, the legislation would not exist. An essential feature of all politics is that all of life is political; that is, no action exists without a cause.

We are now experiencing the politics of nutrition, such as the FDA banning trans fats. While Forbes is a modestly respectable journal, no media news outlet is free from political action, especially when it comes to something as relatable and general as food. The action of publishing this type of article would not exist if it wasn’t for the values of making money, and while not evil in and of itself, the desperate pursuit of profit can lead to sensationalism in media.

The next aspect of nutritional politicization occurs in state sponsored advisory groups. As an established organization of a republican democracy (in the US), state advisory groups are an attempt to free the profit motive from information. However, state advisory boards, like all facets of life, engage in political action. Regarding saturated fats, the USDA writes that

Cut back on foods containing saturated fat including:

desserts and baked goods, such as cakes, cookies, donuts, pastries, and croissants

many cheeses and foods containing cheese, such as pizza

sausages, hot dogs, bacon, and ribs

ice cream and other dairy desserts

fried potatoes (French fries) – if fried in a saturated fat or hydrogenated oil

regular ground beef and cuts of meat with visible fat

fried chicken and other chicken dishes with the skin

whole milk and full-fat dairy foods

https://www.choosemyplate.gov/saturated-unsaturated-and-trans-fats

However, despite asserting that all of these foods should be avoided because of their association with fat, they have ignored that these listed products contain processed sugars, salt, and lactose (a form of sugar) which may impede your physical health as much as fats, possibly. The values of promoting the general welfare are only as good as the understanding of correlations is. See the AHA claiming that coconut oil is bad.

The final group which engages in nutritional politics is lobbying groups, who like media groups have a vested interest in framing actions through value sets. So much so that their salary depends upon it. Lobbying in the US is a billion dollar industry, and agricultural industries upon which fats are produced- both plant-based and farmed- are large industry with pecuniary interests. Its not a shock then that heterogenous products would be pitted against each other with the ease of exploitation the connotation of terms such as good and bad through marketing as well as lobbying.

Everyone is subject to political action. At its most fundamental level, every aspect of life is political. However, the action of using data to make a claim to your own benefit on a pecuniary basis has consequences which, least of all, result in an extreme general misunderstanding of a single topic. This is the case with fats. Are they good? Bad? Honestly, I do not know. There are simply too many vested interests making claims.

For more criticism on the politic of nutrition, check out this video!

Ethical Materialism; Will Money Make Me Happy?

We have all heard the cliché adage, “money can’t buy happiness”. However, the contradicting grade school retort “well, no one ever looks sad on a jet ski” brings up an interesting ethical question; What is the relationship between money and happiness? The folks at Visual Capitalist believe that they have found the answer to the question, and conveniently graphed it for us. In their survey of the relationship, they came to the conclusion that yes, money is tied positively with happiness, to a point. In line with the diminishing marginal utility of money, the data, based on reports from the World Bank and the World Happiness Report 2017, shows a relationship confirming that money is only as good as it provides for the material needs of a person, and then does not provide the same amount of happiness per dollar, at a diminishing rate.

The graph itself is a visual ensemble of grid points which intersect with nations at points reflecting GDP per capita as an indicator of ‘happiness’.

https://www.visualcapitalist.com/relationship-money-happiness/ for a higher resolution image

In this chart, average household income is the only variable of happiness used, but shows a surprising trend that money only provides happiness to a certain limit, and that the trend is not a general rule.

Nearly half of the countries used in this data set are below the ‘happiness trend line’, which would refute a supposed positive correlation of an increase in money with an increase in happiness. However, half of the countries are also above that line, almost implying that the study itself is inconclusive. That’s only partially true, because the interesting results are in the early increases of money by regional specificity. Central and South American countries increase their happiness with initial average money increases between $10K and $20K at an incredible amount, whereas middle eastern countries and south Asian countries do not follow the same trend, floating below the trend line. This seems to imply a cultural significance in happiness, which correlates nicely with the variables used in determining happiness in the World Happiness Report 2017; GDP per capita, social support, healthy life expectancy, freedom to make life choices, generosity, and perceptions of corruption.

So, to give money its due credit, it does play a role in living well. The scattered results seem to imply that money increases happiness when it meets living standards, that is can provide the basic material necessities of life. However, money as a measure of GDP per capita is not an adequate measure because the averages taken for a nation ignore incredible gaps of disproportionate incomes (i.e. income inequalities) that may account for datasets from the middle east.

Money and happiness do have a relationship, but that relationship is dependent on other factors and is subject to diminishing marginal happiness (or utility) around the $40K-$60K markers. The strongest case for money increasing happiness seems to lie in actuality in the $10K-$20K markers in Central and South America. However, I personally believe that there are other factors not accounted for here when comparing on a global scale, such as the cost of living standard which varies incredibly between cities, let alone nations. There are also religious and cultural factors which place less on material wellbeing to focus on mental or spiritual enlightenment which may skew the data. As for Ethical Materialism, the jury has still not reached a verdict.

Man Verses Machine; Will AI Increase Inequality?

Or, ‘Did the 19th Century Luddites Understand Capitalist Employment?’

The inequalities of income and wealth in our society is the determining feature of our nation’s economic and political success. In comparison with other developed, capitalist nations, the United States ranks tenth in income inequality and second when state redistributive functions are accounted for. According to Emmanuel Saez’s research, in 2012 the top one percent of families made 22.5% of gross income, up from 10.8% in 1982, while 90% of the population only accounted for 49.6%, down from 64.7% in 1982. Richard Wolff’s research shows that wealth inequality is even worse than income inequality, with the top fifth of families holding 88.9% of all wealth in America. Inequality is a severe economic issue, for our capitalist system of production is based in consumer demand, and the largest demographic of consumers are those most hurt by growing income and wealth inequality. Productivity has increased 74.4% from 1874 to 2013, however, hourly compensation has only increased by 9.2% in the same span of time. The difference between productivity and compensation shows us that employer profits are increasing while workers compensation is not matching the revenue they generate. There are a number of causes for this gap, likely globalization, the lack of collective bargaining, and specifically advances in technology. Simply put, the cause of inequality in its most general form is hyper-efficiency in profit-generation. Further more, new research is showing that advances in AI may replace up to 50% of jobs in the united states. Will the advances in artificial intelligence increase income and wealth inequality in the US? If employment trends follow their historical trends, then the introduction of AI into the workforce will most likely increase the unequal distribution of income and wealth.


In a study posted by the World Economic Forum, the current speculation (the risk) regarding the percent of the workforce that will be replaced by automation in the US is 47%, relatively low compared to less developed nations. However, that is nearly 50% of the US workforce which human workers will be excluded from. This is important because workers are consumers (see Marx’s simple circuit of for laborers, C-M-C), and consumer spending makes up 68% of the US economy. Over 2/3 of the economy is driven by workers, and 50% of the workforce is at risk of replacement- that is, exclusion from a wage.

https://www.weforum.org/agenda/2018/04/ai-has-a-gender-problem-heres-what-to-do-about-it/

So how exactly will the introduction of artificial intelligence increase inequality? The answer lies with John Maynard Keynes. In The General Theory of Employment, Interest, and Money, John Maynard Keynes calls the principle of effective demand the “explanation of poverty in the midst of plenty.”[1] As an explanatory device of understanding the allocation of wealth in an economy, the principle of effective demand is a powerful tool in the pursuit of understanding economic inequality because it is the aggregate of the fundamental axioms of allocation and distribution in a capitalist economic system. The first characteristic of the principle of effective demand is that “the propensity to consume and the rate of new investment determine between them the volume of employment.”[2] Employment is determined by the willingness of consumers to part with their money (the propensity to consume is the first factor of the Demand schedule, D1), and the rate of corporate investment into production and wage compensation (The second factor in the sum of the Demand schedule, D2) driven by the expectation of profit (Z). The production schedule of privately owned means of production is dictated by the profit off sales to consumers, and access to the products of the privatized means of production is dictated by money, acquired through a wage.

[1] Keynes, John Maynard. The General Theory of Employment, Interest, And Money. (New York; First Harvest/Harcourt) 1964, page 30

[2] Ibid, page 30

The Principle of Effective Demand, Courtesy of John P. Watkins

The employment of AI (i.e. a preference for capital [K] over labor [L]) is an example of the aforementioned hyper-efficiency in profit-generation. Furthermore, the shift in employment preference towards capital is a result of the neoliberal policies enacted in the Reagan era. The progressive moment following the Great Depression and WWII did cause the cost of human labor to increase, and put more people in employment, but set up the conditions which increased shifting of the employer preference towards the employment of more capital than human labor. Capital does not need humane working conditions. Capital does not take breaks or go on vacation. Humans were not designed. Humans evolved randomly through mutations that happened to benefit our existence. Capital is designed to work. Capital is efficient, and efficiency is the doctrine of profit. The progressive movement saw a decline in the seventies, as did the age of prosperity, and the “need for flexibility in production was extended to the need for flexibility in labor markets.”[1] This is owning to the growth of “post-fordist production techniques based on the information and communication technology revolution”[2],which caused the strengthening of capital utilization unless workers gave up their benefits and left the unions, thus devaluing their capabilities.


[1] Bowles, Paul. Capitalism. (Great Britain; Pearson Education Limited) 2007, page 18

[2] Ibid, page 18


In conclusion, if employment trends follow the same model of the past 50 years, income and wealth inequality will increase with the introduction of artificial intelligence in the workforce. The inequality may even be furthered by the economic crises following the worker displacement and efficient production, such as a crisis of overproduction and underconsumption. Unless policy trends which historically favor the 1% become more humanistic, and take into consideration the workers whose backs the American economy rests upon, artificial intelligence will become the danger to society it has been represented as in fiction. Except, instead of The Terminator, it will be The Baconator (artificial intelligence under the employment of McDonalds, I am aware this is a stretch) which upsets the modern era.

Public Policy Priority Polls and Machiavellian Politicians

In a FiveThirtyEight article titled “What Issues Should Democrats Ignore in 2018”, Micah Cohen attempts to bring into reality the tweeted statement of Nate Silver, ”Everybody always writes columns about why Democrats or Republicans should pay more attention to issue X. It would be actually way more useful if people wrote columns about what they should pay *less* attention to” by combining data from the Pew Research Center and a Gallup poll. His results are of no worth towards a discussion, as they are merely opinions. However, this topic of federal candidates picking and choosing issues in a political landscape based on statistically based priorities leads me to ask, how does releasing this poll data affect the election outcomes? Preying upon public priorities is a harrowing tactic that reinforces politics as a game in which winning is the sole prerogative (i.e. in which the end justifies the means of acquiring the end). We need not look any farther than the House of Cards character, Frank Underwood (or Donald Trump) to understand what this kind of systematic republican campaigning technique will invoke. Or, take Machiavelli’s advice to the princes of Italy, “Appear as you may wish to be”. In the same manner that Machiavelli advised the prices to prey off the idealized virtues of the masses, so too are we encouraging politicians to prey off what’s important to us, and informing them of what to avoid in order to win without giving up their authentic self, character, or topics of expertise or passion.

An example of public polls on priorities is from the Pew Research Center, one of the largest and most influential research institutions in the US.

This image has an empty alt attribute; its file name is 012518_2.png

http://www.pewresearch.org/fact-tank/2018/01/29/state-of-the-union-2018-americans-views-on-key-issues-facing-the-nation/

I may be in a minority, but I was not polled. The methodology of this survey does not include how many people

I will concede that it appears beneficial to inform our elected or campaigning body on what we as a people prioritize. However, we must consider who is represented in these polls and how the demographics who vote may misrepresent the priorities of minority groups. It is better to hear someone speak and make a decision on whether or not they are the right vote for you, than to tell someone what you want to hear, have hem say it, and then vote for them because they said what you wanted them to say. Using Trump as a convenient example, Politifact revealed that as of now Trump has only kept 16.7% of his campaign promises, as compared to 17.6% of his campaign promises that have been broken. Empty promises for which align a candidate with your values that never come to fruition.

We as a people must learn to subvert the advice Machiavelli gives. For, as he advises the prince to appear virtuous (generous, compassionate, etc) but not be virtuous, we should watch out for those who seem without flaws, or are perfect in everyway and yet never fulfill their promises. We must examine the unexamined.

All we get from encouraging politicians to speak to us on what we want to hear is a vacuum. The person elected is a complete stranger who’s power is derived from their popularity, and no other metric. When our political offices are filled with those appealing to our priorities while in reality pursuing their own, we end up with our current executive administration. In no occasion do I see it fit for the prey to provide the predator with the tools to exert as little effort as possible in advancing.

The Spectre of Inflation In A Modern Monetary Economy

The traditional view held of monetary inflation is that an increase in the money supply results in an increase in the price level. The change of price between two periods of time is the general notion of ‘inflation’, described as a percentage. However, the understanding of inflation rests upon a critical axiom which remains unexamined despite the rapid changes that have occurred in the late twentieth century and the twenty-first century; that inflation has been measured in terms of physical currency which have volume and take up physical space. As of 2018, only (roughly) ten percent of the United States’ wealth is expressed in physical currency. The other ninety percent is digital– numbers on computer screens. At this time, we are afforded the chance to inquire whether or not increases in digital currency impact the price level (i.e. does increasing the mostly digital money supply result in inflation?).

In order to determine the percentage of physical currency in circulation, a ten year review of “Currency in Circulation” and the “Gross Domestic Product” from the Federal Reserve Economic Data of St. Louis (FRED) indicate the estimation of physical currency in circulation in the US.

U.S. Bureau of Economic Analysis, Gross Domestic Product [GDP], retrieved from FRED, Federal Reserve Bank of St. Louis; https://fred.stlouisfed.org/series/GDP, January 20, 2019.

Board of Governors of the Federal Reserve System (US), Currency in Circulation [WCURCIR], retrieved from FRED, Federal Reserve Bank of St. Louis; https://fred.stlouisfed.org/series/WCURCIR, January 20, 2019.

“Currency in Circulation” is descriptive of “paper currency and coin held both by the public and in the vaults of depository institutions”, while the GDP is “the market value of the goods and services produced by labor and property located in the United States” unadjusted for inflation. Both data sets show a generally stable incline, with the physical currency consistently about ten percent of the total monetary wealth in America, thus concluding that the other ninety percent of wealth is digital.

When we compare the “Consumer Price Index For All Urban Consumers” to the stable inclines expressed in the previous data sets, we see a similar stability of inclination (although it is worth noting it is less stable and fluctuates more often)


U.S. Bureau of Labor Statistics, Consumer Price Index for All Urban Consumers: All Items [CPIAUCSL], retrieved from FRED, Federal Reserve Bank of St. Louis; https://fred.stlouisfed.org/series/CPIAUCSL, January 20, 2019.


The Consumer Price Index for All Urban Consumers is a measure of the “average monthly change in the price for goods and services paid by urban consumers between any two time periods”, i.e. the price level. The CPIs are based on “prices for food, clothing, shelter, and fuels; transportation fares; service fees (e.g., water and sewer service); and sales taxes.”

The major takeaway from this survey is that there is much more research to do to reach any semblance of a conclusion. I would appreciate available data which splits physical and digital currency expressions as to better compare to the price level. However, I cannot deny there is a general inclining trend within the graphs that indicates there is still the spectre of inflation haunting a nearly digital economy. It is worth addressing that I do not believe there is a causal relationship indicated, as there are moments in the CPI which would indicate a reduction in the inflation rate while the monetary growth was stable, and I am uncertain as to the affects the remnant ten percent of physical currency has on the price level in a physical manner. Thus, we leave this noting a correlation between growth in the physical and digital monetary supply with changes in the price level, and a potential starting point for an inquiry into the other factors which may affect inflation, such as the market power of corporations.