Teen Depression: “It’s the phones!” But is it?

In 2012, more than 50% of Americans owned a smartphone and teen depression rates have drastically been on the rise since 2011. Unsurprisingly, multiple studies have focused on the “iGen” (those born between 1995 and 2012–per Twenge, 2017) and followed the trends of increased screen time and teenage depression rates. Jean Twenge explains in her article “Have Smartphones Destroyed a Generation?” that there is a stark positive correlation between these two variables. It would seem, then, that to decrease teens’ likelihood of experiencing depression, they should also decrease their screen time. Unfortunately, the solution to alleviating teen depression is far more complex than simply turning off their cell phones, and Twenge creates causations from her data that are most likely just correlations and patterns that need a more in-depth analysis.

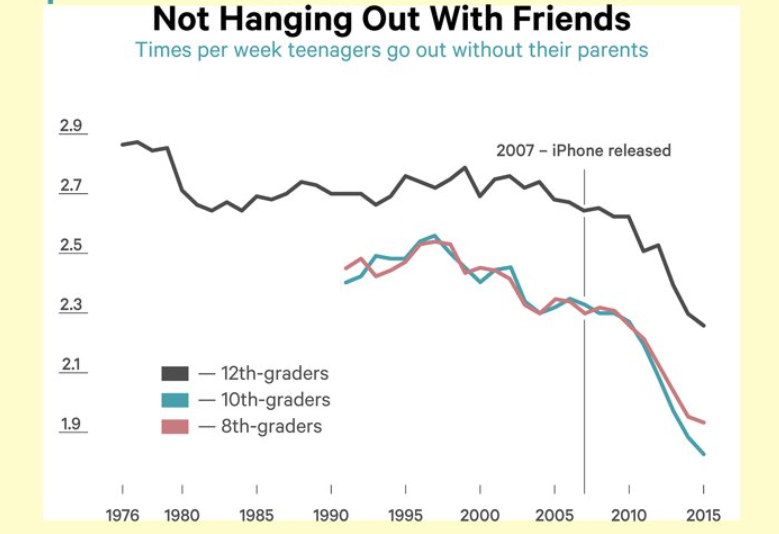
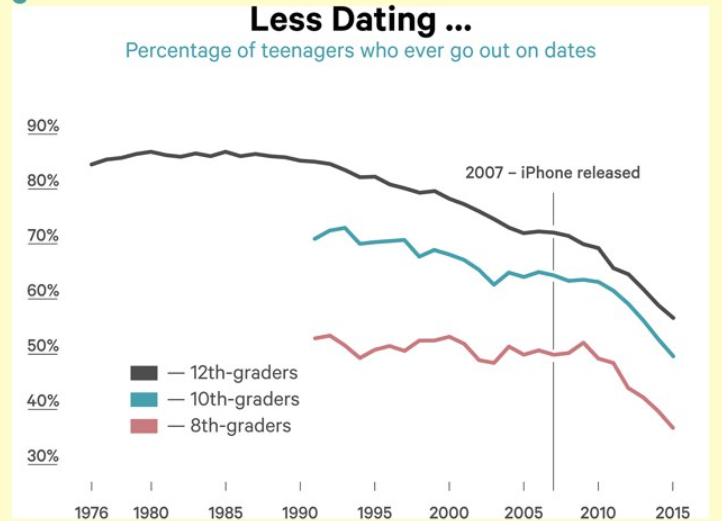
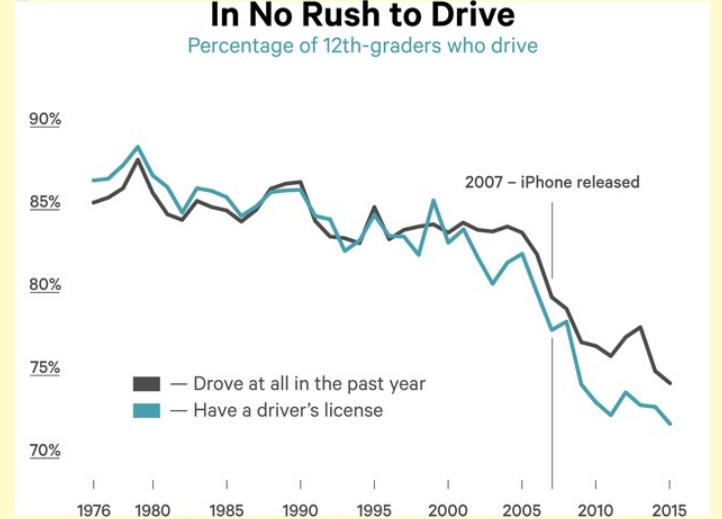
Twenge draws connections between screen time and teen depression by noting the three following trends (also depicted in the graphs above): “12th-graders in 2015 were going out less often than eighth-graders did as recently as 2009″, “..only about 56 percent of high-school seniors in 2015 went out on dates; for Boomers and Gen Xers, the number was about 85 percent” and that one in four teens lack a drivers license by the time they finish high school (Twenge, 2017). Essentially, teens today are single, staying home, aren’t driving anywhere, and are horridly depressed. Although the statistics provided are interesting, they do not analyze the crux of the problem, and merely hope that the numbers will provide a valid-enough argument to make the case that phone time leads to depressive teens. The overarching conclusion is that “Teens who spend three hours a day or more on electronic devices are 35 percent more likely to have a risk factor for suicide, such as making a suicide plan” (Twenge, 2017) and further categorizes risk factors into gender and age groups. Although this data shows relevant trends that need to be addressed, unfortunately analysts like Twenge are chasing parked cars and spewing data that is already well-known, without delving into the real issue.

Brian Resnick of Vox addresses the lack of conclusive evidence of studies linking tech use and teen depression, by reminding readers that the data right now is inconclusive and warrants further inquiry, but not a doomsday narrative.

“Studies like these are rife with such caveats, and more. In general, such studies do not asses causality, they do not include clinical assessments of mental health (just questionnaires), they somewhat arbitrarily define what counts as well-being, they rely on self-reports, and they often use “screen time” or “electronic device use” as a catchall variable to include any type of media use”.

Resnick, 2019

One problem with the question of teen depression and screen time, is in the question itself. What is screen time? Researches like Twenge use ‘screen time’ as an overarching variable that encompasses: reading, writing, studying, social media, etc. which is a complex variable that needs to be delineated to draw a more direct conclusion. There are also not plausible, effective methods for monitoring screen time without a breach of privacy or accounting for frequent user-reported errors such as reporting that they spent time reading news instead of scrolling through Facebook.

Finally, defining a subjective variable such as depression is incredibly difficult and can alter results based on the definition. In the Twenge study, suicidal factors were determined by whether participants ‘felt depressed for more than two days in a row over a two week time period’ instead of reported suicide attempts, for example.

The correlation between screen time and teen depression is a question that is more than worthy of significant inquiry. However, we must also question what and who is on the screen that is making such a negative impact on our youth population, instead of demonizing the smartphone industry and screen time as a whole. For now, the data needs more work and teens (and the general population) should be aware of factors within their screen time that may induce negative feelings.

Resources:
Twenge, Jean M. “Have Smartphones Destroyed a Generation?” The Atlantic, Atlantic Media Company, 19 Mar. 2018, http://www.theatlantic.com/magazine/archive/2017/09/has-the-smartphone-destroyed-a-generation/534198/.

Resnick, Brian. “Have Smartphones Really Destroyed a Generation? We Don’t Know.” Vox, Vox, 22 Feb. 2019, http://www.vox.com/science-and-health/2019/2/20/18210498/smartphones-tech-social-media-teens-depression-anxiety-research.


DNA and Culture: They Are Not The Same

Ancestral DNA analytics platforms such as Ancestry have given people information on their geographical history as well as rough percentages of racial association, however, this practice is inherently problematic both in its methodology and results. Sites such as Ancestry compare one’s genetic data multiple times across hundreds of regions to determine the strongest DNA markers which then constitute an ancestral DNA timeline. Unfortunately, individuals in power have used these results to demonstrate their association with peoples of indigenous regions when heritage is much more complicated than DNA. A prime example is senator Elizabeth Warren, who has used her DNA results to claim a status as a Native American on legal documents to fulfill diversity quotas for her law school, and to win a wager against Trump who denied and mocked her Native American heritage. Although Warren does have Native American ancestry (she is somewhere between 1/32nd and 1/1,024th Native American), it is her proclaimed association with the Native American culture that is problematic. To better understand the culture behind the DNA samples, we must recognize the consequences of this type of data.

“As Vox’s Dylan Matthews explained in February, Warren has consistently said that her mother is part Cherokee, even though Warren herself isn’t an enrolled member of the three federally registered Cherokee tribes. Her ancestors don’t appear on the Dawes Rolls, an official list of members of the Cherokee, Choctaw, Creek, Chickasaw, and Seminole tribes put together in the early 20th century.”

(Stewart, 2018)

Let’s begin with simple definitions of culture and DNA. DNA is merely a combination of nucleotides that make up a living organism, while culture is “the customs, arts, social institutions, and achievements of a particular nation, people, or other social group” (Google Dictionary). Ancestral DNA testing relays very little information besides a crude geographical estimate of where our ancestors stood for a period of time, and must not constitute as means of a connection or relationship with the cultures displayed in the analysis. As the quote relays above, Warren has no substantial relationship with the Cherokee tribes, and should not be using her smidgen of ancestral DNA to establish her political platform. Once those individuals in positions of power begin to lay claim to ancestral and cultural ties that are not apparent, then other cultures begin to be appropriated.

It is imperative that ancestral DNA not be equated to culture for the sake of cultural sovereignty and differentiation. Simply because my nucleotides are similar to those of a different race and/or culture in history does not justify my place in that culture if I am not actively participating in that culture, or am merely using the status for a personal/political/social gain.

The reason this type of data is so tricky is because it has to do with personal identity. The title DNA analysis makes it seem as if this data will tell us who we are, when in reality it simply tells us where we have probably been. DNA is what we are made up of, while culture influences who we are. The intermingling of these two worlds has allowed for people like senator Warren to claim status as a woman who has Native American DNA, but nearly no cultural connection to said culture. The results of DNA testing being used as political rhetoric is absurd and inconsequential because minority cultures have no political power to speak out or influence the issues. For the sake of cultural and to save the sliver of respect other cultures/countries may have for the U.S. we need to draw the line between DNA and culture and see the differences between them as an opportunity to learn, and not as a method of establishing a connection to those who we may personally know little to nothing about.

Resources:

Stewart, Emily. “Elizabeth Warren Releases Her DNA Test Results and Dares Trump to Make Good on His $1 Million Bet.” Vox, Vox, 15 Oct. 2018, http://www.vox.com/policy-and-politics/2018/10/15/17978258/elizabeth-warren-native-american-claims-dna-test.

Did the 2016 Presidential Election Polls Have Significant Errors, or were Americans Just In Denial?

We all remember the watch parties, the calm before the storm, watching the blue states turn red, and suddenly the results were in. They were not as expected, nor as projected. The results of the 2016 presidential election were jarring for some–especially media moguls–and people frantically searched for a reason as to why democracy had failed them, and they found one: the polls. While the polls did generally predict that Hillary would win, were the polls drastically off the mark, or were Americans simply looking for any reason beyond themselves, that Mr. Trump had been elected as POTUS? Unfortunately for some, the latter is most certainly true.

The above graph shows the margin of error of voting in the polls between two candidates of that respective election cycle. Meaning that the polls missed the actual voting margin of Trump and Clinton in 2016 by 3.1 percent–a full point below the national average error in polling (the total average at the bottom of the chart). Per the graph, polls done in the 2004, 2008, and 2012 election were all highly accurate and potentially gave false expectations to those who depended on polls for trending data concerning what was happening throughout the 2016 election, but the results above show that the 2016 polls fared more accurate than the national historical average, and were no reason to sound the alarm.
The accuracy of the polls is further explained in a 2017 report by the American Association for Public Opinion Research, which confirms that the polls were not to blame.

“National polls were among the most accurate in estimating the popular vote since 1936. Collectively, they indicated that Clinton had about a 3 percentage point lead, and they were basically correct; she ultimately won the popular vote by 2 percentage points”.


(Kennedy, et al.)

Although Clinton did secure the popular vote, further polling showed that the electoral college vote was where the upset occurred.


“Eight states with more than a third of the electoral votes needed to win the presidency had polls showing a lead of three points or less (Trende 2016)”.


(Kennedy, et al.)

The RealClearPolitics poll Trende pulled from noted that Clinton had a narrow projected electoral college victory (272-266) and Trump only needed to win a single battle-ground state (one of the eight mentioned in the quote above) to secure the election. Trump’s win notably came from winning in Pennsylvania, Michigan and Wisconsin (all of which were predictably ‘blue states’ prior to the 2016 election) and while the polls were not 100% correct, they were not statistically significant in their margin of error such that Americans could blame the polls for giving them the false hope of having their first female, democratic president.
Although the polls were not remarkably erroneous, there are obvious critiques as to how polling could be improved. From the 2016 election, polling cites did not expect Trump’s overwhelming support in the Midwest, or the Shy Trump Effect (where voters claimed to be a Clinton supporter, but voted for Trump come election day), and a plethora of other variables. Polling can, and most certainly should be, improved to produce better results in the future. However, despite all the uncontrollable variables, the 2016 polls were not to blame for the election results and they were not unreliable. Inevitably, 2016 was a volatile race that was statistically too close to call, but the polls did a pretty damn good job of trying.
All we can do is hope for a better 2020, and let the polls keep polling.


Resources:
Kennedy, Courtney, et al. “An Evaluation of 2016 Election Polls in the U.S.” AAPOR, American Association for Public Opinion Research, http://www.aapor.org/Education-Resources/Reports/An-Evaluation-of-2016-Election-Polls-in-the-U-S.aspx.

Gelman, Andrew, and Julia Azari. “19 Things We Learned from the 2016 Election.” Taylor and Francis Online, Journal of Statistics and Public Policy, http://www.tandfonline.com/doi/full/10.1080/2330443X.2017.1356775.

Is the Increase in Participatory Politics Racially Representative?

Participatory Politics is defined as “Interactive, peer-based acts through which individuals seek to exert influence on issues of public concern”. Data from the Participatory Politics Study by New Media and Youth Political Action suggests that 41% of young people ages 15-24 engage in participatory politics, most of which is in the social media realm. 

(Cohen & Kahne YPP Study)

Donald Trump and Alexandria Ocasio-Cortez may be political opposites, but they share one major trait in common: their knowledge and influence over social media platforms which encourage participatory politics. Facebook comment wars are commonplace, Instagram and Twitter have become legitimate sources of information for millennials and younger generations, and participatory politics is growing in popularity and scope. However, when analyzing the increasing trend of participatory politics, it is important to analyze the minority level of engagement so that political figures may accurately spread information that can be seen/heard by their intended audience. So, does the increase in participatory politics accurately represent the minority youth?

Cathy J. Cohen of the University of Chicago and Joseph Kahne of Mills College (along with their respective research teams) conducted a survey with 3,000 participants aged 15-25 years old. Their participant base included “large numbers of Black, Latino, and Asian-American respondents” (Cohen & Kahne 9) from a variety of states and socio-economic backgrounds. The diversity of this data-set is promising and draws from minority groups to be more representative, so Cohen and Kahne drew the following graphical conclusions from their survey:

Figure 16 B shows that the general youth currently gather their information from participatory channels such as Twitter and Facebook as well as interpersonal relationships, instead of traditional forms of media such as newspaper and magazines. Furthermore, the disparity between races and their average participatory actions within a week, is significantly less than most would assume—as seen in figure 18 on the right. The four surveyed races have a similar percentage of participatory political acts, and visit/interact with multiple channels of information gathering; meaning that activity in participatory politics is racially diverse according to this specific sample.
            The conclusions drawn from the sample are sound, however the sample is not entirely representative. Cohen and Kahne admit that “Because the sampling design deviated from a simple random sample of the population, particularly in its oversampling of minority groups, the raw data are not a representative sample of young people in the US” (Cohen & Kahne 40). However, a priority of the study was to include more minority youth, so the claim that it is not a simple random sample is true, but it should not detract from the validity of the study. If anything, this study should be expanded upon to include more minority races, and gather more respondents to continue to legitimize the sample and its conclusions.
            From Cohen and Kahne’s study, it is apparent that the racial differences within participatory politics do exist, but the differences are not as large as one may have previously thought. It is important to recognize the racial and socio-economic limitations of minority groups so that others can help to bridge the divide, and create a more cohesive society that is politically informed and has equal opportunity to exercise their privilege to participate in political issues.

References:
Cohen, Cathy J, and Joseph Kahne. Participatory Politics. MacArthur Foundation’s Digital Media and Learning Initiative, ypp.dmlcentral.net/sites/all/files/publications/YPP_Survey_Report_FULL.pdf.

Why the Stall for “The Wall”?

In May 2018, Trump stood in front of signs which read “Promises made, Promises kept” and reassured the general public that Mexico would pay for the wall that would divide the U.S. and Mexico. Trump has made this claim over 212 times, so why has the wall yet to be built?
Clearly this was a wishful promise made on the campaign trail that has had a difficult time facing its reality within the federal government. Unfortunately for the president, Mexico will not be paying for the wall, and cannot be forced to do so. The graph below has an array of implications that must be unpacked prior to analyzing if the data behind building a wall is sound. The density of claims made by Trump lie within his campaign season throughout 2016. This can be attributed to his multiple campaign speeches, rallies, and the building of his voter base. Once Trump was sworn into office, the claims significantly decline in both number and frequency. The Wall was a hefty promise that had fallen to the wayside in the beginning of Trump’s presidency. But, the beginning of 2018 saw an increase in wall mentions due to the discussion of the revision of NAFTA–now known as the USMCA. Now that the context of the wall mentions is known, we can analyze why the wall has yet to be built and/or paid for.

In November 2018 the USMCA (United States Mexico Canada Agreement–essentially a “revamped NAFTA”) was implemented, and with the new legislation came new promises.

With the release of Trump’s tweet, should Americans not all be reassured that even if Mexico will not directly pay for the wall, then this new trade agreement will? Unfortunately for the president and his supporters, not so much.
In the tweet, Trump is referring to the (potential) decrease of the trade deficit with Mexico from the USMCA. However, a decrease in the trade deficit does not cause an increase in the federal government’s money supply. A trade deficit means that country A buys more goods from country B, than country B buys from country A. With the USMCA, the U.S. will be buying fewer goods from Mexico. Purchasing goods from within the U.S. instead of Mexico will theoretically lower the deficit, but the money saved from purchasing U.S.-based-goods remains with the consumer, and not the federal government. Therefore, Mexico would still not be paying for the wall, even indirectly.
Using relatively simple math, it is clear that the data does not support Trump’s claims.


“What’s more, Trump already starts at a disadvantage. In 2016, the trade deficit with Mexico was $55.6 billion, meaning that it increased by $8 billion during Trump’s first year in office. Presumably then, we need the trade deficit to drop by $26 billion — that $8 billion increase plus the $18 billion cost for the wall — to come out ahead on this thing”. (Bump 2018)

The data above from the Washington Post article is sufficient because the author uses trade data that is well known and federally backed. Furthermore, the data is supported by the simple understanding of how a trade deficit operates and what lowering the deficit implies for each country–meaning that Mexico does not necessarily lose money and the United States does not gain money either.
The conclusions drawn by the Washington Post are sound in math and logic, but it must be noted that the Washington Post is left-leaning and is particularly averse to the current administration. However, political biases aside, the data is against the president’s claims and the wall will most likely have to wait to be built for another time.

Citations:

Kelly, Meg. “No, the USMCA Doesn’t Mean Mexico Is Paying for the Wall.” The Washington Post, WP Company, http://www.washingtonpost.com/video/politics/no-the-usmca-doesnt-mean-mexico-is-paying-for-the-wall/2019/01/08/f22dd079-d74b-4592-a802-6fbd60ff8e03_video.html?utm_term=.460123e14037.

Bump, Philip. “Trump Got Mexico to Pay for the Wall by Simply Changing the Meaning of ‘Pay’ and ‘Mexico’.” The Washington Post, WP Company, 13 Dec. 2018, http://www.washingtonpost.com/politics/2018/12/13/trump-got-mexico-pay-wall-by-simply-changing-meaning-pay-mexico/.

Compromise or full-of-lies? The political data behind the government shutdown

The tumultuous 2016 election was the beginning of never-before-seen political volatility that has left both sides of the isle questioning the future of the American people and the country. Over 800,000 federal employees plead for compromise as the government shutdown enters its fifth week, so why are their concerns falling on deaf ears?   
            John Sides from the Washington Post provides the graph below which shows that politically engaged Democrats are more apt for compromise than their Republican counterparts. This data can be applied to the government shutdown fairly easily: House Democrats are eager for a compromise, but the Republican president refuses any proposal that does not satisfy his requirements, leading to a prolonged shutdown. Unfortunately, the data within the graph is not that simple and the conclusion drawn by John Sides is problematic. We must examine the terminology of the data to understand why the conclusion that Democrats favor compromise more so than Republicans is fallacious.

The first flaw with Slides’ conclusion stems from the source of the data which determines the meaning of “political engagement”. The GW Politics Poll is cited in a book by John Zaller, who cites his own “comprehensive theory to explain how people acquire political information from the mass media and convert it into political preferences” (Zaller2011). Novels upon novels have been written about the influence of media within politics, and determining one’s political engagement based on mass media consumption is obviously problematic for a plethora of reasons.
            Slides further confuses the reader by affirming that politically engaged people are also synonymous with those who are more educated—cited with data from the Pew Research center. If one were to look at the same webpage as where Slides found data on the educational gap for compromise, you would see that Pew has determined that the political gap for compromises does not exist as shown in the second graph below.

Slides has selected data that pertains to his argument that Democrats are more willing to compromise, while ignoring data from a source he pulled from in the same article. Despite this obvious dilemma of sources and validity between Slides and Pew Research Center, neither source defines nor scales “compromise”. For arguments sake, it is highly difficult (if not impossible) to argue the existence or nonexistence of compromise when one has not defined what compromise is or looks like.  
            Although Slides attempted to explain the government shutdown through his own lense, the conflicting terminology of politically engaged/educated and lack of definition for compromise create a muddy conclusion that is difficult to discern the truthfulness of the data. If a reader did not click the links Slides provided in the article to discover Pew’s opposing research, their opinion could be based on improper data. As we all have learned, there is more to a graph than what is shown, and this instance is no different. Franklin D. Roosevelt summarizes it best with the quote: “In politics, nothing happens by accident. If it happens, you can bet it was planned that way”.

Sources:
Sides, John. “Many Americans Say They Want Politicians to Compromise. But Maybe They    Don’t.” The Washington Post, WP Company, 16 Jan. 2019,             www.washingtonpost.com/news/monkey-cage/wp/2019/01/16/many-americans-say-they-         want-politicians-to-compromise-but-maybe-they dont/?utm_term=.fb111d5b7f36.
           
“8. The Tone of Political Debate, Compromise with Political Opponents.” Pew Research Center         for the People and the Press, Pew Research Center for the People and the Press, 18 Sept.           2018,   www.people-press.org/2018/04/26/8-the-tone-of-political-debate-compromise-           with-political- opponents/.

Zaller, John R. The Nature and Origins of Mass Opinion. Cambridge University Press, 2011.